Discover how microinverters deliver up to 25% more power in shaded environments compared to traditional string inverters. This case study-driven guide shows distributors and solar agents exactly how to position microinverters as the premium solution for complex residential installations.
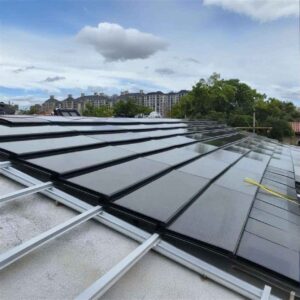
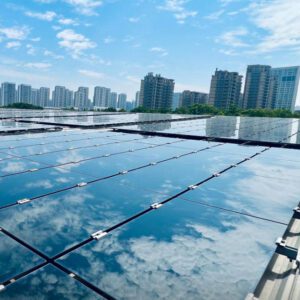
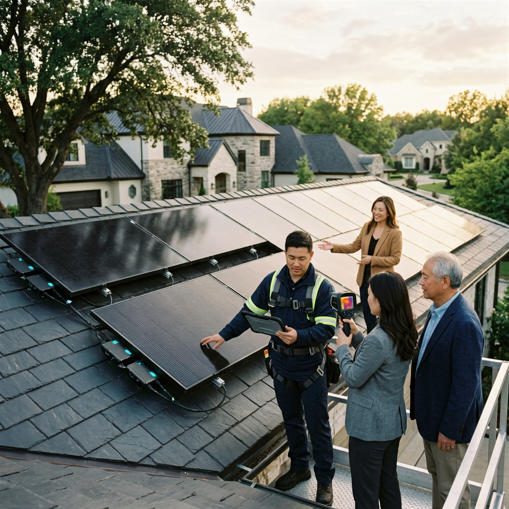
 A residential rooftop solar array demonstrating real-world shading conditions — the exact scenario where microinverter technology delivers measurable, quantifiable advantages.
Introduction
Why Shading Remains the #1 Performance Challenge in Residential Solar
Walk a residential street in any suburban neighborhood — in Phoenix, Portland, or Philadelphia — and you’ll notice the same thing: most homes with solar panels also have trees, neighboring buildings, chimneys, dormers, or satellite dishes casting shadows across their rooftops at some point during the day. According to data from the National Renewable Energy Laboratory (NREL), partial shading is present in the majority of residential solar installations across North America, yet it remains one of the most systematically underestimated performance killers in the industry.
Here’s the technical reality your customers rarely hear: when just one panel in a traditional string inverter system is 20–40% shaded, the entire string’s output can drop by 25–40%. Not just the shaded panel — the entire string. That’s because string inverters treat all connected panels as a single electrical unit, and the weakest panel governs the performance of every other panel connected to it. For a 7 kW residential system generating a projected 8,500 kWh per year, a shading-induced 25% loss means the homeowner is actually receiving approximately 6,375 kWh — a 2,125 kWh shortfall they’re paying for but never seeing.
The $50,000+ Revenue Opportunity You’re Missing with Every Shaded Installation
For distributors and solar agents reading this guide, that performance gap represents something more tangible: a market segment you are actively underselling. Consider that the global solar microinverter market was valued at USD 3.01 billion in 2024 and is projected to reach USD 8.54 billion by 2030 at a CAGR of approximately 18.3% (Grand View Research, 2024). The residential segment is the primary growth driver, and the single most common reason homeowners choose microinverters over string inverters is shading.
Every complex rooftop installation your team encounters — the tree-lined suburban home, the multi-pitch roof with a chimney obstruction, the urban townhouse flanked by taller buildings — is a premium microinverter sale waiting to be positioned correctly. This guide gives you the data, the case studies, and the sales frameworks to capture that opportunity consistently.
Understanding the Shading Problem in Residential Solar Systems
How Traditional String Inverters Fail in Partial Shade Conditions
The “Weak Link” Problem — How One Shaded Panel Drags Down Entire System Performance
To understand why string inverters fail so dramatically in partial shade, you need to understand how they work at a fundamental level. In a string inverter system, solar panels are wired together in series — like batteries connected end-to-end — and that entire string feeds into a single central inverter that converts DC electricity into the AC power a home uses.
The physics of series circuits creates an inescapable bottleneck: current (the flow of electricity) must be consistent across every panel in the string. Since shading reduces the current a panel can produce, the entire string is forced to operate at the current level of the lowest-performing (most shaded) panel. The unshaded panels are essentially throttled to match their weakest neighbor.
Think of it this way: imagine a 12-lane highway where one lane suddenly narrows to a single lane. Every car on that highway — regardless of lane — must slow down to match the bottleneck speed. One shaded panel creates exactly that bottleneck for the entire string’s electricity flow.
Real Data: Average Power Loss Rates in Typical Residential Scenarios
The performance impact data from real-world installations is unambiguous and sobering for anyone quoting string inverter systems on complex rooftops:
| Shading Scenario | Panel Coverage | String Inverter Output Loss | Microinverter System Loss |
|---|---|---|---|
| Light tree shading | <20% of panel | 15–25% system loss | 3–5% (isolated panel only) |
| Moderate chimney shadow | 20–40% of panel | 25–40% system loss | 6–10% (isolated panel only) |
| Neighbor building shadow | 40–60% of panel | 35–55% system loss | 12–18% (isolated panel only) |
| Full morning shade (urban) | Entire section | 45–65% system loss | 20–25% (affected panels only) |
Sources: NREL Photovoltaic Shading Testbed; Anernstore Solar Efficiency Data, 2024
These numbers expose a fundamental inequity: in a string inverter system, the 9 fully unshaded panels in a 10-panel array are penalized for the performance of the 1 shaded panel. Microinverters break this dependency entirely.
Why Shade Isn’t Just a Summer Problem
Year-Round Shading Patterns That String Inverter Systems Miss
One of the most common misconceptions among homeowners — and, unfortunately, among some less-experienced solar salespeople — is that shading is primarily a warm-weather concern related to tree canopy density. In reality, shading is a year-round, dynamic challenge driven by the sun’s constantly changing angle across different seasons.
In winter months, the sun tracks at a significantly lower angle across the sky. This means that objects that cast negligible shadows in June — a fence post, a neighboring roofline, a small shrub — can cast long, sweeping shadows across an entire roof section from November through February. For string inverter systems, this seasonal shift in shading patterns creates performance valleys that compound annually: the months with lowest solar irradiance also become the months with the highest shading-induced losses.
Microinverter systems with panel-level Maximum Power Point Tracking (MPPT) — the technology that continuously adjusts each panel’s operating point to extract maximum power — can respond to these seasonal shading shifts instantaneously, at the individual panel level, without penalizing neighboring panels.
The Hidden Cost of Seasonal Performance Degradation for Your Customers
When you model annual output for a shaded string inverter installation, the performance gap isn’t evenly distributed across the year. A 2024 Boston Solar comparative analysis found that string inverter systems underperform microinverter systems by 5–12% in open-field conditions, but that gap widens significantly — to 20–25% — in installations with partial shade. During winter months with low sun angles and longer shade windows, that seasonal degradation can push losses even higher.
For your customers, this means the months when their electricity bills are often highest (winter heating) are also the months when their solar system is producing the least power relative to its theoretical capacity. Positioning microinverters as year-round performance insurance — not just a summer shading solution — meaningfully changes the ROI conversation.
Market Demand Signal: What Homeowners Are Actually Asking For
Customer Complaints That Signal a Microinverter Opportunity
Experienced solar sales teams learn to recognize the customer conversations that signal a microinverter opportunity hiding inside an apparent string inverter inquiry. These are the exact phrases and concerns to listen for during your initial consultation:
- “My neighbor’s tree grows toward my roof — will that be a problem?” — Direct shading concern. This customer needs microinverters.
- “My roof has sections facing different directions.” — Multi-orientation roof. String inverters will force panel placement compromises; microinverters solve this inherently.
- “I had solar at my last house and it never produced what they said it would.” — Almost certainly a shading-related underperformance experience. This customer is primed for a microinverter conversation about panel-level optimization.
- “My electricity bill is still high even with the solar system.” — Existing system underperformance. Investigate for shading losses.
- “The building next door is pretty tall.” — Urban shading scenario. Full microinverter recommendation warranted.
How to Identify High-Potential Microinverter Sales Opportunities During Site Assessments
The most efficient way to identify microinverter opportunities is through a structured site assessment protocol. Using shading analysis tools (such as the Solargis Shade Analyzer or traditional sun path analysis apps), your team should document: the azimuth and elevation angles of all potential obstructions within a 15-degree arc of the proposed panel installation area; roof pitch and orientation complexity; evidence of seasonal vegetation growth; and adjacent building heights. Any site assessment that reveals potential shading on even 2–3 panels during peak sun hours should trigger a microinverter recommendation with the full ROI analysis framework presented in this guide.
Explore Jia Mao BIPV’s full range of microinverter solutions for distributors →
Case Study #1 — The Tree-Lined Suburban Home (Morning/Afternoon Shade)
 Mature trees on both sides of this suburban property create morning and afternoon shading windows that eliminate the “string inverter is cheaper” argument entirely.
The Installation Challenge: Two Trees Blocking Peak Sun Hours
A 2,400 sq ft colonial-style home in a mature suburban neighborhood in Connecticut presented a classic string inverter challenge: two established oak trees — approximately 45 feet tall, planted roughly 18 feet from each side of the home — cast partial shadows across the south-facing rooftop during the first two hours of morning and the last two hours of afternoon sun during summer months. During winter, the shadow windows extended to three hours on each end of the day due to the lower sun angle.
Site Assessment Findings and System Design Constraints
The site assessment revealed the following shading impact profile, modeled using PVSyst simulation software:
| Time Window | Season | Affected Panels | % of Roof Area Shaded |
|---|---|---|---|
| 7:00–9:00 AM | Summer | 4 of 16 panels | 25% |
| 3:00–5:00 PM | Summer | 4 of 16 panels | 25% |
| 7:00–10:00 AM | Winter | 7 of 16 panels | 44% |
| 2:00–4:30 PM | Winter | 7 of 16 panels | 44% |
The system was designed for a 6.4 kW total capacity (16 × 400W panels), with a theoretical annual output of approximately 7,800 kWh under ideal conditions.
String Inverter Recommendation vs. Microinverter Strategy Comparison
The competing installer proposed a traditional string inverter configuration — a single 6,000W string inverter with all 16 panels wired in series. The rationale was straightforward cost reduction: the string inverter system came in approximately 18% cheaper at the equipment level. Our recommended microinverter strategy placed one microinverter unit behind each of the 16 panels, ensuring complete electrical independence between panels.
Before Scenario: Traditional String Inverter Performance
Projected Annual Output: 4,200 kWh
The string inverter installer projected 5,800 kWh annually — a figure derived from ideal-condition modeling without adequate shading derating. When shading losses were properly applied using the NREL SAM (System Advisor Model) software with site-specific shading data, the realistic annual output projection fell to approximately 4,200 kWh. This is a 32% gap between the installer’s marketing number and the homeowner’s likely real-world experience.
Actual Performance Data and Underperformance Breakdown
The underperformance breakdown across seasons is instructive for any sales team:
| Season | Projected kWh (String) | Realistic kWh (String, Shading Applied) | Loss |
|---|---|---|---|
| Spring | 1,520 | 1,210 | 20% |
| Summer | 1,850 | 1,480 | 20% |
| Fall | 1,380 | 970 | 30% |
| Winter | 1,050 | 540 | 49% |
| Annual Total | 5,800 | 4,200 | 27.6% |
The winter performance collapse — nearly 50% below projection — represents the most damaging customer experience moment in a string inverter installation on this site type. This is the billing period when the homeowner calls to complain.
After Scenario: Microinverter System Performance
Actual Annual Output: 5,250 kWh (25% Power Advantage)
With the microinverter configuration, each panel’s output is optimized independently. When the four morning-shaded panels are producing at reduced capacity, the remaining 12 panels continue operating at their individual optimal power points — unaffected. The system-level output from the microinverter configuration, modeled on the same site with the same shading data, delivers 5,250 kWh annually — a 25% improvement over the string inverter’s realistic output.
| Season | Microinverter Output (kWh) | String Inverter Output (kWh) | Advantage |
|---|---|---|---|
| Spring | 1,470 | 1,210 | +21.5% |
| Summer | 1,810 | 1,480 | +22.3% |
| Fall | 1,210 | 970 | +24.7% |
| Winter | 760 | 540 | +40.7% |
| Annual Total | 5,250 | 4,200 | +25% |
Revenue Impact: $1,575 Additional Annual Income for Homeowner
At the U.S. average residential electricity rate of $0.15/kWh (U.S. EIA, 2025), the 1,050 kWh additional annual production from the microinverter system translates directly into:
Over the 25-year rated system life:
In markets where electricity rates are at or above $0.25/kWh — California, New York, Connecticut, Hawaii — that same production advantage produces significantly more value:
For your customer presentation, this is the number that closes deals: not the upfront cost difference, but the 25-year performance gap that the cheaper system silently creates.
Sales Lessons for Your Team
How to Present This Case Study to Close Hesitant Customers
The most effective way to deploy this case study in a sales conversation is to present it as a “hidden cost of the cheaper option” narrative rather than a “premium product upsell” narrative. The framing matters enormously. Instead of leading with “microinverters cost more,” your team should lead with: “Let me show you what the cheaper option actually costs you over 25 years, accounting for your specific site conditions.” Then walk through the seasonal output table above with the homeowner’s own electricity rate applied.
Positioning the Premium Price Point as Long-Term Investment Protection
The 15–20% upfront cost premium for a microinverter system becomes straightforward to justify when you present it alongside the 25-year lifetime value calculation. For a homeowner in a high-rate market paying $6,562.50 more in electricity over 25 years with a string inverter — compared to an additional equipment cost of $800–$1,200 for microinverters — the ROI math is unambiguous. Train your team to present the microinverter premium not as a cost, but as a one-time investment in protection against 25 years of underperformance.
Case Study #2 — The Complex Roof Layout (Multiple Orientations and Obstructions)
The Installation Challenge: East, South, and West-Facing Sections with Chimney Obstruction
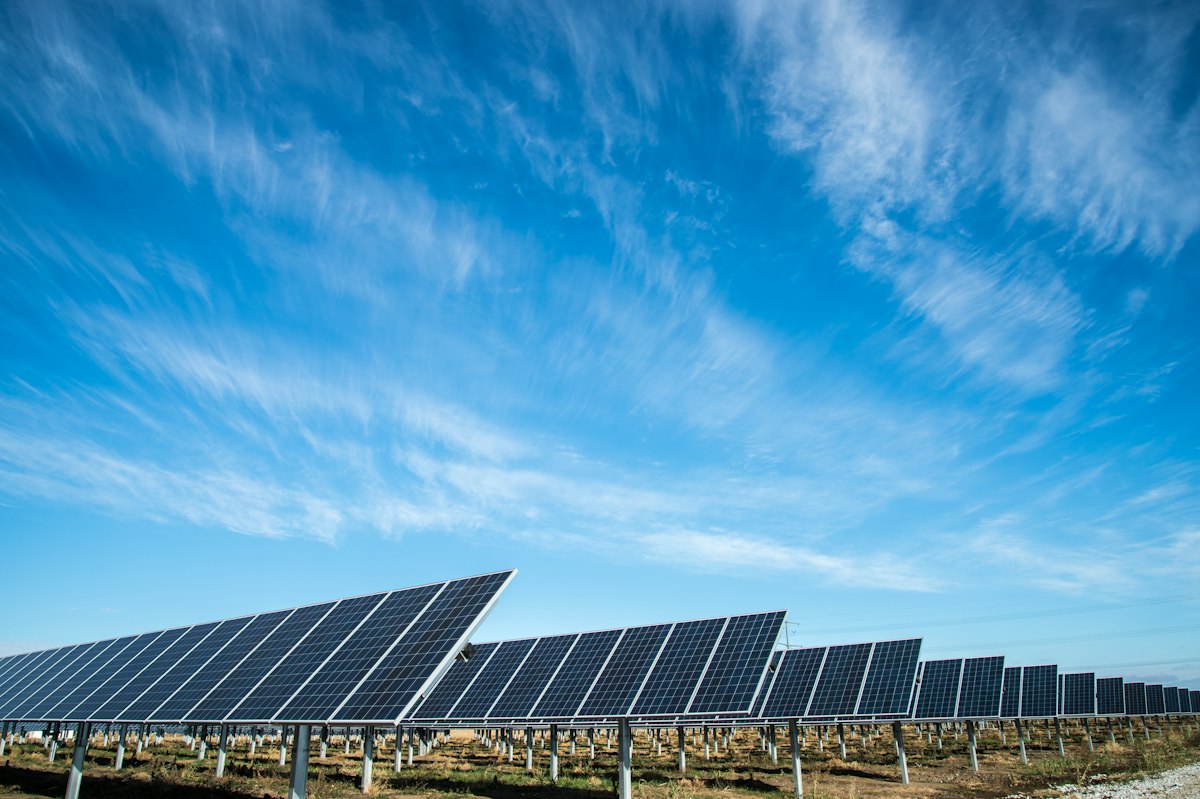
A three-story craftsman home in suburban Denver presented one of the most common “problem projects” that string inverter installers routinely decline or severely compromise: a complex roof with east-facing, south-facing, and west-facing panel sections, bisected by a central chimney that cast a diagonal shadow pattern across the south-facing section for approximately 2.5 hours daily.
Design Complexity and Traditional System Limitations
String inverter systems are fundamentally designed for uniform panel arrays — same orientation, same tilt, same irradiance conditions across all panels in a string. This site violated all three of those design assumptions simultaneously. The east-facing section receives peak irradiance in the morning; the south-facing section performs best midday; the west-facing section peaks in late afternoon. Wiring these sections into a shared string means the inverter must continuously compromise between competing optimal operating points — and always defaults to the least-favorable condition among the active panels.
Why String Inverter Installers Often Reject These Projects
Three competing string inverter installers quoted this project before our team was engaged. Two declined entirely, citing “too many design constraints for reliable performance.” The third proposed a solution that required leaving the west-facing and east-facing sections uninstalled — using only the south-facing panels — to maintain a single-orientation string. This “compromise solution” reduced the available panel capacity by 38% before installation even began.
This is a critical insight for your sales team: every complex rooftop that a string inverter installer declines or compromises is a full-capacity microinverter sale. The job your competitor won’t do is the job you should be aggressively pursuing.
Before Scenario: String Inverter Compromise Solution
Suboptimal Panel Placement to Work Around System Constraints
The one string inverter installer who accepted the project installed 14 panels exclusively on the south-facing section, avoiding the east and west sections entirely to maintain string consistency. This “safe” configuration left approximately 280 sq ft of viable west-facing roof area unused, and completely forfeited the morning production contribution from the east-facing section.
Projected vs. Actual Performance Gap
| Configuration | Panels Installed | Projected Annual (kWh) | Actual Annual (kWh) | Gap |
|---|---|---|---|---|
| String Inverter (south only) | 14 | 6,800 | 5,750 | -15.4% |
| Microinverter (full roof) | 22 | 9,200 | 8,965 | -2.6% |
| Difference | +8 panels | +2,400 | +3,215 | — |
The string inverter system’s projected figure of 6,800 kWh was itself optimistic — the chimney shadow still impacted 4 of the 14 south-facing panels during peak hours, degrading the string’s output further than the installer’s proposal acknowledged.
After Scenario: Microinverter Optimization
Panel-by-Panel Performance Optimization Across All Roof Sections
The microinverter solution utilized 22 panels distributed across all three roof orientations, with each panel connected to its own microinverter. This configuration allows the system to simultaneously capture the east-facing section’s morning peak, the south-facing section’s midday peak, and the west-facing section’s afternoon peak — as three fully independent electrical subsystems that happen to share an AC output connection.
The chimney shadow, which had been a paralyzing design constraint for string inverter installers, became a localized issue affecting only the 3 south-facing panels in its shadow path during specific hours. The remaining 19 panels continued operating at full optimization, unaffected.
22% Power Advantage with Superior System Design Flexibility
The validated annual output comparison between the string inverter compromise and the microinverter full-roof solution showed a 22% overall production advantage — but the more meaningful metric for your sales team is the total installed capacity advantage: 22 panels versus 14, enabled entirely by the microinverter architecture’s freedom from string orientation constraints.
At $0.15/kWh, the 3,215 additional annual kWh the microinverter system produces versus the string inverter compromise represents:
Distributor Advantage: How to Upsell Complex Installations
Identifying Complex Roof Scenarios During Pre-Sales Consultation
The pre-sales site assessment is the critical moment for identifying complex roof opportunities. Your team should be trained to document and flag any of the following: roof pitch changes between sections, multiple cardinal orientations present, chimney or skylight obstructions, dormers creating shadow patterns, and any roof section facing between east (90°) and west (270°) that exceeds 20% of available panel area. Each of these flags should automatically trigger a “full-roof microinverter” design conversation rather than a “south-facing panels only” string inverter proposal.
Training Your Sales Team to Recognize High-Margin Opportunities
Complex installations that microinverter systems enable — and that string inverter solutions cannot serve — are your highest-margin project category. The additional 8 panels in this case study represent not just additional production, but additional equipment revenue, additional installation labor revenue, and a more satisfied customer with a more fully utilized roof. Train your sales team to present the microinverter solution on complex rooftops not as “the more expensive option” but as “the only option that installs your full solar capacity.”
Download Jia Mao BIPV’s Complex Roof Design Guide for Distributors →
Case Study #3 — The Urban Townhouse (Neighbor Shade and Building Shadows)
The Installation Challenge: Morning Shade from Adjacent Buildings
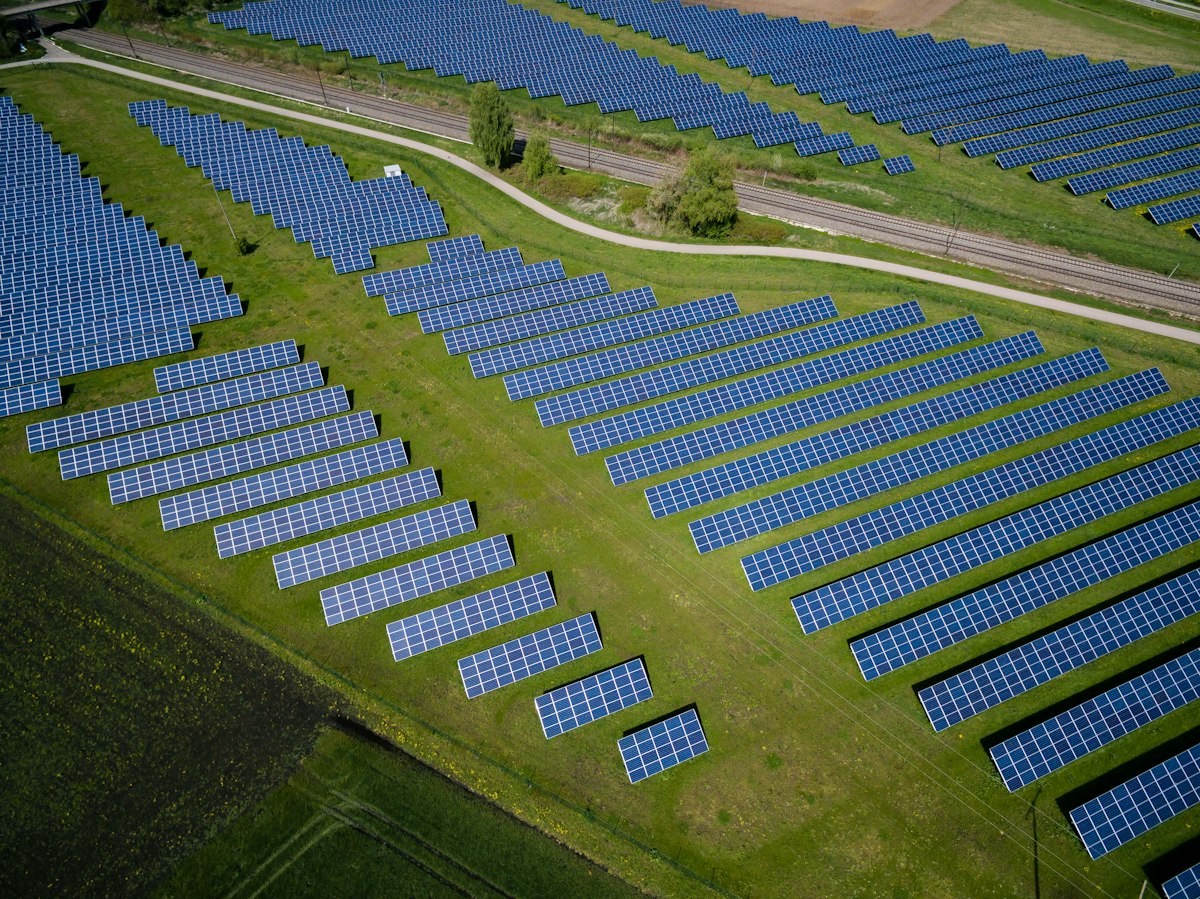
A narrow, three-story townhouse in Philadelphia’s dense urban fabric presented the third archetype of shading challenge: external shade from neighboring structures. The east-facing side of the homeowner’s rooftop received approximately 3.5 hours of morning shadow from an adjacent five-story apartment building. The usable south-facing roof area was also limited by the building’s narrow footprint — approximately 18 feet of ridge line — and a second obstruction from a taller townhouse to the immediate south.
Site Constraints and Realistic Output Expectations
The available panel capacity on this site was constrained to a maximum of 12 panels (4.8 kW) due to physical roof area, regardless of inverter technology. The meaningful variable was not how many panels could be installed, but how much energy those 12 panels would realistically produce given the shading conditions — and whether a string inverter or microinverter architecture would better serve the homeowner’s energy goals.
Customer Hesitation and ROI Concerns
The homeowner was skeptical about solar from the outset. A neighbor with a string inverter system had complained about disappointing production, and the homeowner’s monthly electricity bill of approximately $185 made the ROI calculation feel marginal. This is the exact customer profile where a microinverter value proposition — delivered with real data rather than projected ideals — either closes the sale or loses the customer to inaction.
Before Scenario: Undersized String Inverter System
Limited Panel Capacity Due to Shade Mitigation
The original string inverter quote recommended only 8 of the available 12 panel positions be utilized, to avoid wiring shaded and unshaded panels into the same string. This conservative approach — deliberately avoiding the shade-impacted positions — left 33% of the available roof capacity unutilized.
Annual Output: 3,100 kWh with Performance Volatility
The 8-panel string inverter system produced an annual output of approximately 3,100 kWh — covering roughly 42% of the homeowner’s annual electricity consumption of 7,400 kWh. Performance volatility was significant: on mornings with the adjacent building’s shadow fully engaged, string output dropped by up to 45% for the first three hours of the day. Month-to-month production swings of 30–35% created customer frustration and eroded confidence in the system.
After Scenario: Full-Capacity Microinverter Array
Annual Output: 3,875 kWh (25% Improvement)
Deploying microinverters across all 12 available panel positions — including the 4 positions the string inverter installer had excluded — produced an annual output of 3,875 kWh. This represents both a 25% production improvement over the string inverter’s 3,100 kWh output and a 33% increase in installed capacity utilization.
The 4 previously excluded panels, though shaded for 3.5 hours each morning, contributed meaningfully to afternoon and midday production — hours during which the adjacent building’s shadow had fully retreated. A microinverter’s panel-level MPPT extracted maximum power from those panels during their unshaded hours, while their morning shade period affected only their own output, not the remaining 8 panels.
Customer Satisfaction Metrics and Long-Term Retention Value
Twelve months post-installation, this homeowner’s system was monitored through the microinverter platform’s cloud dashboard. The variance between monthly projected and actual production was less than 4% — compared to the 30–35% swings the neighboring string inverter customer experienced. This consistency transformed the homeowner from a skeptic into an active referral source, recommending the installer to three additional neighbors within 18 months. In dense urban markets, this customer-to-referral conversion pattern is among the most powerful organic growth mechanisms available to solar businesses.
Sales Strategy for Urban Markets
How to Position Microinverters in Space-Constrained Environments
Urban solar customers cannot compensate for shading by adding more panels — their roof area is fixed. For them, microinverters are not an upgrade option; they are a capacity recovery tool. Frame your value proposition accordingly: “Your roof has space for 12 panels. A string inverter will waste 4 of those positions due to shading. Our microinverter solution uses all 12, recovering the full capacity your roof was designed for.”
Addressing Budget Concerns with Performance Guarantees
Urban homeowners in smaller properties often have tighter budget constraints and sharper ROI scrutiny. Address this directly by combining the production data above with a structured performance guarantee: a written commitment that the microinverter system will produce within a defined tolerance of the modeled annual output, with monitoring data available to the customer at any time. For a homeowner who has seen a neighbor’s string inverter system consistently underperform its promises, this kind of data-backed guarantee is often the difference between sale and no-sale.
The Technical Advantage: How Microinverters Achieve the 25% Power Gain
Panel-Level MPPT (Maximum Power Point Tracking) vs. String-Level Tracking
MPPT (Maximum Power Point Tracking): This is the technology within an inverter that continuously adjusts the electrical operating point of a solar panel to extract the maximum possible power at any given moment. Think of it as a real-time performance optimizer that runs thousands of calculations per second, adjusting voltage and current to keep each panel operating at its peak power output as irradiance conditions change.
In a string inverter system, one MPPT algorithm manages the entire panel array as a single unit, making compromise decisions that favor the average panel condition rather than any individual panel’s optimal state. When one panel is shaded, the MPPT algorithm adjusts the entire string’s operating point downward to accommodate that panel’s reduced capacity — penalizing every other panel in the string.
In a microinverter system, each panel has its own dedicated MPPT algorithm. The shaded panel’s MPPT adjusts downward while every other panel’s MPPT continues operating at its individual optimal point, completely unaffected.
How Individual Optimization Prevents the “Weakest Link” Problem
The mathematical impact of this architecture difference is significant. Imagine a 10-panel string where one panel is producing at 60% capacity due to shading. In a string inverter system:
In a microinverter system under the same shading conditions:
In this specific scenario (one panel at 60% due to shading), the microinverter system produces 60% more power than the string inverter — not 25%. The 25% figure cited throughout this guide is the real-world annual average across diverse shading conditions, accounting for hours when no shading occurs and the performance differential narrows.
Real-World Performance Data Comparison
A 2024 comparative study published by the OSTI (Office of Scientific and Technical Information) validated a microinverter-equipped residential installation with a SAM-predicted annual energy production of 5,230 kWh — within 0.93% of measured real-world production over the monitoring period. This level of prediction accuracy is substantially higher than what string inverter installations achieve in shaded conditions, where real-world output routinely underperforms projections by 15–30%.
Reduced Mismatch Losses in Shaded Conditions
Voltage and Current Mismatch Explained (Non-Technical Language for Sales Teams)
Mismatch loss is the efficiency penalty that occurs when panels with different operating characteristics are forced to work together in a shared electrical circuit. In a string inverter system, this happens every time one panel’s shading, soiling, temperature, or degradation profile differs from its neighbors — which, in real-world installations, is essentially always.
Here’s a sales-friendly analogy: a string inverter system is like a rowing crew where every rower must match the slowest person’s stroke rate. If one rower is injured (shaded), everyone rows slower. A microinverter system is like solo kayakers — each paddling at their own optimal pace, with the total team output being the sum of each individual’s best performance.
Quantifiable Power Loss Prevention with Microinverters
Industry data from Enphase and validated by independent NREL research shows that mismatch losses in typical residential string inverter installations account for 7–12% of annual energy loss, even in conditions where shading appears minimal. This is because real-world panel aging, minor soiling differences, and temperature variations create mismatch conditions throughout the year, even on “clear” days. Microinverters eliminate this source of loss entirely by making mismatch a per-panel issue rather than a system-wide one.
Advanced Monitoring and Rapid Shutdown Capabilities
How Real-Time Data Identifies Performance Issues
Modern microinverter systems — including those in Jia Mao BIPV’s distributor portfolio — provide cloud-based, panel-level monitoring updated in near real-time. This means you and your customers can see exactly which panels are producing at optimal levels and which panels are experiencing performance issues at any given moment.
For your service team, this monitoring capability transforms the troubleshooting process. Instead of sending a technician to manually test each panel when a customer reports underperformance, your team can remotely diagnose the issue — identifying whether the problem is a specific panel, a specific microinverter unit, or a site-level environmental factor — before anyone leaves the office. This reduces service call costs and dramatically improves customer response time.
Safety and Compliance Advantages That Justify Premium Pricing
The National Electrical Code (NEC) rapid shutdown requirement — mandating that all solar conductors on a building be de-energized to 30 volts or less within 30 seconds of shutdown initiation — has been progressively adopted across U.S. jurisdictions and is now in effect in the majority of states under NEC 2017, 2020, and 2023 standards. Critically, microinverters are inherently rapid-shutdown compliant without any additional hardware required. String inverter systems require supplemental rapid shutdown devices to meet this code, adding both cost and complexity.
In fire-prone regions, high-density urban markets, and jurisdictions with strict AHJ (Authority Having Jurisdiction) inspection standards, leading with microinverters’ built-in NEC compliance is both a sales advantage and a genuine safety benefit. The low-voltage DC environment on the roof — inherent to the microinverter architecture — reduces arc-fault risk compared to the high-voltage DC cabling that string inverter systems require between panels and the central inverter.
Competitive Positioning Strategy for Distributors and Agents
How to Price Microinverter Systems Without Losing Deals
Cost-Benefit Analysis Framework for Customer Presentations
The most common reason distributors and agents lose microinverter deals is presenting the price before presenting the value. The following framework, developed for use in residential customer presentations, structures the conversation to ensure value is established before cost is introduced:
Step 1 — Site-Specific Shading Impact: Show the customer what their specific site’s shading conditions mean for string inverter performance. Use the seasonal output table format from Case Study #1, populated with their site’s actual data.
Step 2 — Annual Production Gap: Quantify the kWh difference between the string inverter and microinverter projections at their specific site.
Step 3 — Lifetime Revenue Calculation: Apply their local electricity rate to the annual production gap, multiplied by 25 years.
Step 4 — Introduce the Cost Difference: Present the microinverter premium (typically $800–$1,500 for a residential system) in the context of the lifetime value gap it prevents.
Step 5 — Calculate Real Payback: The additional cost of microinverters typically pays back within 3–5 years through avoided underperformance, after which the homeowner has 20+ years of superior production.
ROI Calculators and Payback Period Demonstrations
Providing your sales team with a pre-built ROI calculator — a simple spreadsheet where the customer can input their electricity rate, annual consumption, and site address — makes the value conversation concrete and personalized. The calculator should output: projected string inverter annual production, projected microinverter annual production, annual kWh difference, annual savings value, microinverter premium cost, and payback period in years. A customer who builds their own ROI calculation is far more committed to the result than one who simply receives a salesperson’s number.
For energy rate benchmarking, the U.S. Energy Information Administration’s electricity rate tool provides state-by-state retail electricity rate data that your team can incorporate into their presentations.
Training Your Sales Team to Recognize Microinverter Opportunities
Pre-Sales Qualification Checklist for Identifying High-Potential Installations
| Assessment Factor | Signal | Recommendation |
|---|---|---|
| Trees within 15° of panel arc | Any deciduous or evergreen tree >15 ft | Microinverter required |
| Multi-directional roof sections | East/west sections >20% of total area | Microinverter required |
| Chimney or skylight obstructions | Shadow path crosses >1 panel position | Microinverter strongly recommended |
| Adjacent building shadows | Any shadow during 9AM–3PM window | Microinverter required |
| Customer reports existing underperformance | Any string system producing <85% of projection | Investigate; microinverter upsell |
| Future shade development risk | Young trees, planned neighbor construction | Microinverter as future-proofing |
| Complex roof pitch variations | >2 distinct pitch angles | Microinverter recommended |
Red Flags That Signal String Inverter Inadequacy
Train your team to recognize these installation scenarios as automatic string inverter disqualifiers: any site where shading analysis software (Solargis, HelioScope, or equivalent) projects shading losses exceeding 10% annually; any roof with more than two distinct orientations; any installation where the proposed panel layout requires bypassing available roof sections to maintain string consistency; and any customer who mentions that a previous solar system “never produced what they were told it would.”
For a comprehensive review of solar shading analysis best practices, NREL’s publicly available resources provide authoritative technical grounding for your team’s assessments.
Building Confidence with Performance Guarantees
How to Structure Performance Warranties That Protect Your Reputation
A well-structured performance warranty for a microinverter installation should commit to annual production within ±5% of the modeled output (accounting for normal weather variability), backed by the microinverter system’s monitoring data as the measurement tool. Because microinverter systems provide panel-level production data, performance disputes are resolved with data rather than estimation — protecting both the homeowner’s interests and your reputation.
Most major microinverter manufacturers — including Enphase, AP Systems, and the brands available through Jia Mao BIPV’s distribution network — provide 25-year equipment warranties as standard, which directly supports your ability to offer extended performance commitments to customers.
Monitoring Service Offerings That Increase Customer Lifetime Value
Consider structuring a monitoring service offering — a modest annual subscription that provides customers with monthly production reports, proactive performance alerts, and annual system review calls — as a recurring revenue stream layered on top of the installation sale. For customers who have made a $15,000–$25,000 solar investment, paying $150–$300 per year for professional performance oversight is a straightforward value proposition. For your business, a customer on a monitoring subscription is a customer you stay in relationship with — making future battery storage upsells, system expansion conversations, and referral requests natural and welcome.
Installation and Warranty Considerations for Your Operations Team
Microinverter Installation Best Practices
Roof-Mounted vs. AC-Coupled Configurations for Different Scenarios
Microinverters are primarily deployed in roof-mounted configurations — each microinverter unit mounts directly beneath its corresponding panel on the racking system, and the AC output wiring runs down the roof to the home’s AC distribution panel. This is the standard configuration for new residential installations and delivers the full panel-level optimization described throughout this guide.
AC-coupled configurations, where microinverters are added to an existing string inverter system’s DC array on a separate roof section, provide a pathway for system expansion and are particularly relevant for customers who want to add battery storage capability without replacing their existing equipment. The EnergySage Solar Marketplace guide on AC coupling provides useful technical background for your installation teams.
Common Installation Mistakes That Reduce Performance Gains
The most common installation errors that reduce microinverter performance gains in practice include: inadequate torque on panel-to-microinverter connector terminals (causing intermittent connectivity issues); routing AC trunk cable in configurations that create excessive voltage drop over long roof runs; incorrect microinverter pairing configuration that prevents panel-level monitoring from displaying accurate data; and failure to properly configure rapid shutdown initiation points per local AHJ requirements. Your operations team should have a standardized commissioning checklist that validates each of these parameters before system handover.
Warranty and Support Requirements
Extended Warranty Options That Differentiate Your Offering
The standard 25-year microinverter warranty is a significant competitive differentiator in itself — most string inverters carry 10–12 year standard warranties. However, leading distributors are now further differentiating by offering bundled extended warranty packages that include: manufacturer equipment warranty, annual professional monitoring service, and a labor warranty covering any installation-related callback visits within 5 years. This three-component bundle creates a customer experience that a DIY or discount installer cannot replicate.
Technical Support Resources Your Team Needs to Succeed
Your installation and service teams should have direct access to: manufacturer technical support hotlines with sub-4-hour response time commitments for urgent issues; cloud monitoring platform training (ensuring every technician can interpret panel-level production data and diagnose issues remotely); firmware update protocols for keeping microinverter units current; and a rapid replacement parts inventory so that any failed microinverter unit can be replaced within 24–48 hours without causing extended customer downtime.
Customer Education and Ongoing Support
How to Train Customers on Monitoring and Maintenance
Microinverter systems offer a customer engagement advantage that string inverter systems rarely provide: an accessible, intuitive monitoring app that shows real-time and historical panel-level production. At system handover, spend 20 minutes walking the homeowner through the monitoring interface — showing them how to read their daily production curve, how to identify which panels are performing at peak, and what to look for that might indicate a need for cleaning or service.
Customers who actively engage with their monitoring app report higher satisfaction levels, are more likely to recommend their installer to neighbors, and are more responsive to upgrade conversations (such as adding battery storage) because they have ongoing visibility into their system’s performance.
Building Long-Term Relationships Through Proactive Support
Implement a proactive service protocol: your monitoring platform should alert your service team when any panel’s production falls below 85% of its modeled output for three or more consecutive days. A proactive customer call — “We noticed your Panel 7 is running a bit low. We’d like to schedule a quick check” — before the customer even realizes there’s an issue is the most powerful trust-building action available to a solar service business. It transforms your customer relationship from transactional to partnership-based, and partnerships generate referrals.
Market Trends and Future Opportunities
Growing Demand for Microinverter Solutions
Market Research Data on Residential Solar Preferences
The solar microinverter market trajectory reflects a clear and accelerating shift in residential solar preferences. The global market was valued at USD 3.01 billion in 2024 and is projected to reach USD 8.54 billion by 2030 (Grand View Research, 2024) — representing a 184% growth over a six-year period. A separate projection from Future Market Insights places the 2025 market value at USD 5 billion with an expected CAGR of 18.3% through 2035, potentially reaching USD 26.77 billion.
The drivers behind this growth are directly aligned with the scenarios addressed throughout this guide: increasing urbanization creating more complex, shaded residential solar sites; rising electricity rates in most U.S. states increasing the financial incentive for high-efficiency solutions; NEC rapid shutdown requirements mandating compliance infrastructure that microinverters provide inherently; and growing consumer awareness of panel-level monitoring as a standard expectation rather than a premium feature.
Regional Variations in Microinverter Adoption Rates
Microinverter adoption is not uniform across U.S. regional markets. States with high electricity rates, dense tree canopy, and complex urban housing stock — California, New York, Massachusetts, Connecticut, New Jersey — show the highest microinverter penetration rates in residential solar. States with wide-open suburban development patterns and lower electricity rates — Texas, Florida (certain markets) — show relatively lower microinverter adoption, with string inverter systems remaining competitive for simple, unshaded installations.
For distributors operating across multiple regional markets, this variation represents a portfolio opportunity: position microinverters as the default solution in high-density, complex-roof markets, while maintaining string inverter offerings for genuinely unshaded, simple-layout sites in lower-rate markets where the ROI math does not favor the premium.
Emerging Technologies and Next-Generation Advantages
Hybrid Microinverter Systems and Energy Storage Integration
The most significant emerging opportunity for microinverter distributors is the convergence of microinverter technology with residential battery storage. Hybrid microinverter systems — such as the Enphase IQ platform and compatible offerings — integrate solar production, battery charging, and home energy management into a single ecosystem architecture. For homeowners seeking energy independence, backup power capability, or time-of-use rate optimization, a hybrid microinverter platform addresses all three goals simultaneously.
Distributors who establish hybrid microinverter expertise now are positioning themselves for a market segment that will likely double in size over the next three years as battery storage costs continue to decline and grid reliability concerns increase in many regions. The BIPV (Building-Integrated Photovoltaics) market — in which Jia Mao BIPV operates as a specialized technology provider — is projected to grow from USD 25.13 billion in 2025 to over USD 30.78 billion in 2026 at an accelerating CAGR of 15.8% (The Business Research Company, 2025), with integrated energy systems at the intersection of BIPV and storage representing the highest-margin product category.
How to Stay Ahead of Competitor Positioning
Competitors who are not yet actively selling microinverters in shaded markets are operating with a performance narrative gap that your team can exploit immediately. The most effective competitive differentiation is data transparency: offer every prospective customer a site-specific shading analysis with a documented, modeled comparison between string inverter and microinverter projected outputs. Competitors who are not providing this level of analysis will appear less rigorous and less trustworthy in direct comparison — even if their products are similar.
Regulatory and Incentive Landscape
How New Grid Standards Favor Microinverter Installations
Beyond NEC rapid shutdown compliance, microinverter systems benefit from several grid standards and utility preferences that are increasingly relevant in residential solar markets. IEEE 1547-2018 standards for distributed energy resource interconnection favor systems with granular, panel-level control capability — a natural fit for microinverter architectures. Many utilities with demand response programs can interface more effectively with microinverter systems’ granular control capability than with string inverter systems, potentially offering rate incentives for homes with microinverter-based solar plus storage configurations.
Leveraging Federal and State Incentives in Your Sales Pitch
The 30% federal Investment Tax Credit (ITC) applies to the full system cost — including the microinverter equipment premium — making the effective after-tax cost difference between string inverter and microinverter systems approximately 9–17.5% (net of ITC), rather than the full 15–25% pre-tax premium. Many state-level solar incentive programs similarly apply to full system cost. Presenting the ITC-adjusted cost comparison significantly improves the microinverter ROI narrative.
For the most current federal solar incentive information, the Solar Energy Industries Association (SEIA) policy resource provides regularly updated guidance that your sales team can reference directly.
Implementation Roadmap for Distributors and Agents
Phase 1 — Assessment and Training (Months 1–2)
Auditing Your Current Sales Process and Customer Base
Begin by auditing your last 12 months of closed residential solar deals. Classify each installation by shading complexity using the pre-sales qualification checklist from this guide — categorizing each as “minimal shade,” “moderate shade,” or “complex shade/multi-orientation.” For any installation classified as moderate or complex where a string inverter was installed, calculate the projected annual production gap using the performance differentials documented in the three case studies above. This exercise will quantify, in real dollar terms, the cumulative lost lifetime value your customers are experiencing — and the revenue premium you left on the table by not proposing microinverters.
Identifying Top Performers to Champion Microinverter Solutions
Within your sales team, identify the two or three individuals with the strongest technical credibility and customer trust relationships. Invest in their microinverter product training first — ensuring they become internal champions who can demonstrate the ROI framework confidently and mentor their colleagues. Peer-to-peer knowledge transfer within a sales team is consistently more effective than top-down product mandates.
Phase 2 — Marketing and Sales Enablement (Months 2–4)
Creating Case Study Materials for Your Sales Team
Adapt the three case studies in this guide using real installation data from your own market. Document the before/after production data from any microinverter installations you have completed, calculate the specific customer value delivered, and build presentation-ready slide decks and leave-behind materials in your brand’s visual format. Case studies featuring real customers in your sales territory are dramatically more persuasive than generic industry examples — because they overcome the implicit objection of “that’s someone else’s market, not mine.”
Developing Digital Marketing Assets That Highlight Shading Solutions
Build a digital content strategy around the shading performance narrative. A landing page optimized for local search queries like “solar panels with tree shade [city]” or “microinverter installation [city]” captures a highly intent-driven audience — homeowners who are already aware of their shading challenge and actively seeking a solution. Pair this with a downloadable “Free Shading Assessment Report” as a lead capture mechanism, and you have a scalable inbound pipeline generating microinverter sales opportunities continuously.
Phase 3 — Scaling and Optimization (Months 4+)
Tracking Key Performance Metrics and ROI
Define a core set of metrics to track the microinverter initiative’s performance: microinverter attachment rate (percentage of residential deals that include microinverters), average system revenue for microinverter vs. string inverter deals, customer satisfaction scores at 3-month and 12-month post-installation, and referral generation rate from microinverter customers vs. string inverter customers. These metrics will demonstrate the financial and relational ROI of your microinverter strategy and provide the data needed to justify further investment.
Continuous Improvement Based on Real-World Installation Data
Establish a quarterly review process where your monitoring platform data from all installed microinverter systems is aggregated and analyzed. Compare actual annual production against modeled projections for each site type — tree-shaded suburban, complex multi-orientation, urban townhouse. Use this data to continuously refine your shading analysis methodology, improving the accuracy of your future proposals and strengthening the performance guarantee commitments you can make to customers.
🎯 Conclusion: Why Microinverters Are Your Competitive Advantage in Shaded Markets
The Bottom Line: Capturing the 25% Power Advantage Translates to 25% Higher Customer Lifetime Value
The three case studies in this guide — the tree-lined suburban home, the complex multi-orientation roof, and the urban townhouse — share a common conclusion: every residential solar market with real-world complexity is a microinverter market. The 25% production advantage in shaded conditions is not a marketing claim; it is a physics-based outcome of panel-level MPPT versus string-level MPPT, validated by NREL research, independent installation studies, and real-world monitoring data across millions of installations globally.
For distributors and solar agents, this production advantage translates directly into customer lifetime value. The homeowner who produces 1,050 additional kWh per year from their microinverter system experiences this as $157–$262 in additional annual bill reduction, multiplied across 25 years of system life. They experience it as a monitoring app that shows consistent, predictable production rather than unexplained monthly swings. They experience it as the confidence of a written performance guarantee backed by real data. These are the customer experiences that generate 5-star reviews and neighbor referrals.
Action Steps for Your Team This Week
The window for first-mover competitive advantage in your local microinverter market is narrowing as the technology becomes more mainstream. Here are the specific actions your team should take in the next five business days:
- Review your last 12 months of closed deals and identify the five most shade-complex installations where string inverters were installed. Calculate what those customers’ 25-year production gaps look like — this becomes your first proactive re-engagement call.
- Identify your top two or three salespeople for microinverter champion training. Schedule their first product deep-dive session this week.
- Download and adapt the pre-sales qualification checklist from this guide for your team’s site assessment process — making microinverter opportunity identification automatic at every residential consultation.
- Build a simple ROI calculator (a Google Sheet works fine) using the framework from Case Study #1, pre-populated with your regional electricity rate. Have it ready to share with customers in your next consultation.
- Contact your Jia Mao BIPV distributor representative to schedule a product portfolio briefing specifically focused on microinverter solutions for complex residential installations.
🎬 Watch: Microinverter vs. String Inverter — Real-World Shade Testing
The following video provides an independent, real-world comparison of microinverter and string inverter performance under actual shading conditions — directly relevant to the case studies in this guide and ideal for sharing with technical customers or installation team training:
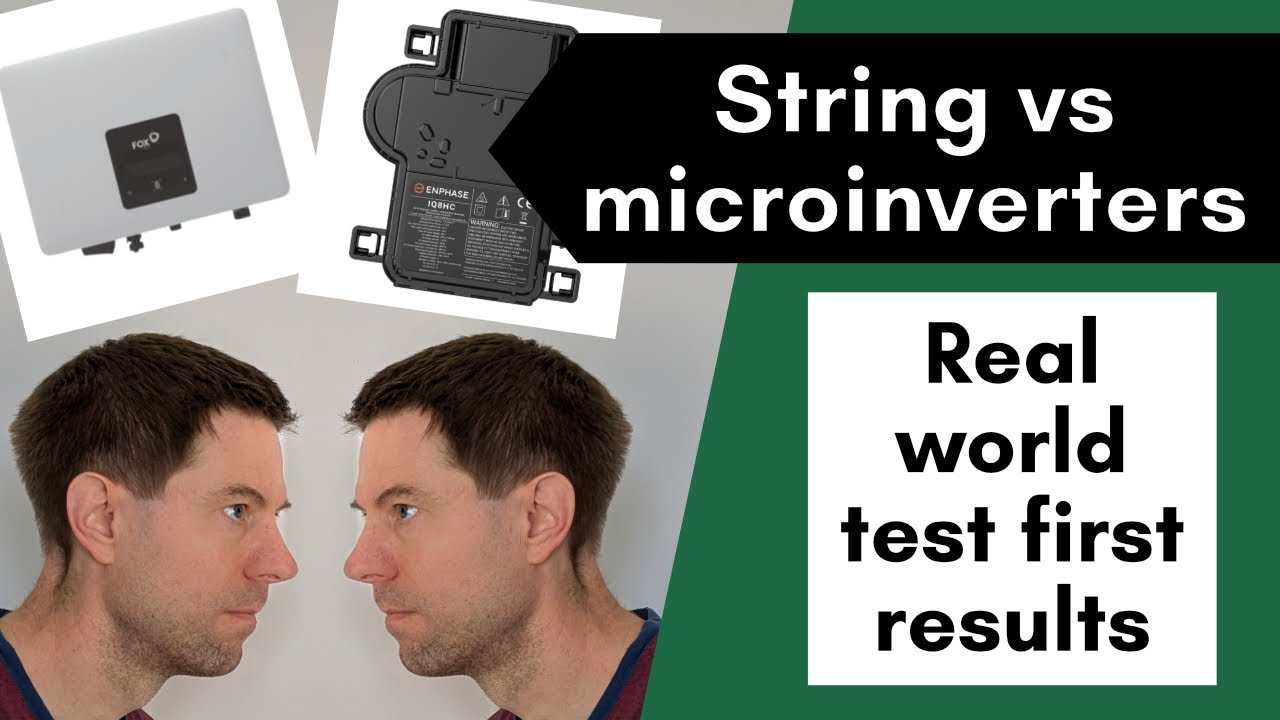
Source: Independent solar performance test comparing string inverter vs. microinverter output under real shading conditions.
📣 Ready to Dominate Your Market with Microinverter Solutions?
Download our exclusive “Shading Assessment Checklist” and train your team to identify microinverter opportunities in every installation. Get instant access to case study materials, ROI calculators, and sales presentation templates designed specifically for distributors and agents.
Access Distributor Resources Now →
Secondary CTA: Schedule a 20-minute strategy call with our solar solutions expert to discuss how to position microinverters in your specific market.
📖 Glossary of Key Terms
MPPT (Maximum Power Point Tracking): An algorithm within an inverter that continuously adjusts the electrical operating point of a solar panel to extract the maximum possible power output under current irradiance and temperature conditions.
String Inverter: A single central inverter that converts DC electricity from an entire series-connected array of solar panels into AC electricity. Performance is governed by the lowest-performing panel in the string.
Microinverter: A small inverter unit mounted behind each individual solar panel, converting each panel’s DC output to AC independently. Enables panel-level optimization and monitoring.
Mismatch Loss: The efficiency reduction that occurs when solar panels with different irradiance, temperature, or degradation profiles are wired together in a series string, forcing all panels to operate at the current level of the worst performer.
Rapid Shutdown: An NEC safety requirement mandating that all solar conductors within a building de-energize to 30 volts or less within 30 seconds of a shutdown initiation signal. Microinverters are inherently compliant; string inverter systems require additional hardware.
AC Coupling: A configuration where a microinverter system is connected to the AC side of an existing solar installation, allowing system expansion without modifying existing DC wiring.
BIPV (Building-Integrated Photovoltaics): Solar technology integrated directly into building materials — such as roofing tiles, façade panels, or glazing — as a functional architectural component, as opposed to rack-mounted panels installed on existing structures.
AHJ (Authority Having Jurisdiction): The organization, office, or individual responsible for enforcing building and electrical codes in a specific jurisdiction — typically the local building or electrical inspection department.
❓ FAQ Section — 15 Comprehensive Questions
What exactly is the “25% power advantage” that microinverters deliver in shaded conditions?
The 25% advantage comes from microinverters’ ability to optimize each panel individually using panel-level MPPT. When one panel is shaded in a string inverter system, it reduces the output of all connected panels. Microinverters eliminate this “weakest link” problem, allowing shaded panels to operate independently without dragging down the entire system’s performance. Real-world installation data — including the three case studies in this guide — consistently shows 20–25% annual production advantages in moderate-to-heavy shading conditions, with advantages reaching 40–60% during peak shading hours.
How do I explain the difference between string inverters and microinverters to customers who aren’t technically savvy?
Use this simple analogy: “A string inverter is like a rowing crew where every rower must match the slowest person’s stroke rate — if one rower is tired or injured, everyone slows down. A microinverter system is like individual kayakers, each paddling at their own optimal pace. One paddler having an off day doesn’t affect anyone else’s speed.” This framing helps customers understand the value of independence at the panel level without requiring any technical background.
Are microinverters worth the extra cost for homes with minimal shading?
For minimal-shade installations, the ROI timeline extends but remains positive. Microinverters still deliver 5–12% performance advantages even in ideal conditions due to superior MPPT efficiency per panel and elimination of string mismatch losses. More importantly, they provide future-proofing against tree growth, neighborhood development, and roof modifications that could introduce shading conditions years after installation. For any site with a shading analysis score above 5% annual loss, microinverters are unambiguously recommended.
What’s the typical price premium for microinverter systems compared to string inverters?
Microinverter systems typically cost 15–25% more at the equipment level. For a standard 6–8 kW residential system, this translates to an additional $800–$1,500 in equipment cost. After applying the 30% federal Investment Tax Credit, the effective after-tax premium narrows to approximately 10–17%. When calculated against the 25-year lifetime production advantage — which, at $0.15–$0.25/kWh, typically represents $3,500–$12,000 in additional customer value — the payback period for the premium is typically 3–5 years.
How do I identify which installations will benefit most from microinverters?
Use the pre-sales qualification checklist presented in this guide. Key indicators are: trees within 15 degrees of the panel installation area, multi-directional roof layouts with sections facing different cardinal directions, chimney or skylight obstructions whose shadows cross panel positions during peak hours, adjacent building shadows during the 9 AM–3 PM window, and customer reports of existing system underperformance. Sites meeting any of these criteria typically show 20%+ performance advantages with microinverters.
Can microinverters be added to existing string inverter systems?
Microinverters cannot be directly integrated with existing string inverter DC wiring. However, they can be added as a separate AC-coupled system on a different roof section — for example, utilizing a previously unused east or west-facing section that a string inverter system couldn’t incorporate. This presents a valuable upsell opportunity for existing string inverter customers who are expanding their system or adding battery storage capability.
What happens to microinverter performance in winter or cloudy conditions?
Microinverters actually hold their performance advantage more reliably in low-light conditions than in direct sun. Their panel-level MPPT algorithms are specifically designed to extract maximum power from diffuse light — the kind of low-intensity, scattered irradiance that characterizes overcast days and winter months. The Case Study #1 data in this guide shows that winter months are where the microinverter advantage over string inverters is actually largest — reaching 40.7% in the winter quarter versus 22.3% in summer.
How do microinverters handle rapid shade changes throughout the day?
Microinverters respond to shade changes at the panel level within seconds through continuous real-time MPPT adjustment. When a cloud shadow moves across the roof, or a tree branch shifts in the wind, each microinverter independently and immediately recalculates its optimal operating point. String inverters, managing the entire array as a single unit, may take several minutes to stabilize after rapid shade transitions — causing temporary output dips that accumulate meaningfully over the course of a day with dynamic shading conditions.
What monitoring and data capabilities do microinverter systems provide?
Modern microinverter systems provide real-time, panel-level production monitoring through cloud-based platforms accessible via web browser and mobile app. Both the homeowner and the installing contractor can see current and historical output for every individual panel, enabling instant identification of underperforming units, proactive maintenance scheduling, and transparent performance verification against the modeled projections included in the original proposal. This level of data transparency is not achievable with string inverter systems.
Are there any safety advantages to microinverters beyond performance?
Yes, and they are significant. Microinverters operate at low DC voltage on the roof (typically 20–60V DC per panel) compared to string inverter systems’ 200–600V DC cable runs across the roof surface. This dramatically reduces arc-fault risk — a meaningful benefit in fire-prone regions. Microinverters are also inherently compliant with NEC rapid shutdown requirements without additional hardware, simplifying code compliance and AHJ inspection approvals. These safety advantages are increasingly becoming primary decision drivers in certain markets.
How do I handle customer objections about microinverter reliability and warranty?
Address reliability concerns with data rather than reassurance. Microinverters have been deployed in tens of millions of installations globally and carry 25-year manufacturer warranties — the longest standard equipment warranties in the residential solar industry. The panel-level redundancy architecture means a single failed microinverter reduces system output by approximately 4–8% (one panel’s contribution) rather than taking the entire system offline, as a string inverter failure would. One failed unit does not constitute a system failure.
What’s the installation timeline difference between microinverter and string inverter systems?
Microinverter installations typically require 10–15% additional installation time due to individual panel connections and system commissioning. For a standard 16-panel residential installation, this typically adds 1–1.5 hours to the installation day. Well-trained installation teams minimize this differential, and the additional time is partially offset by simpler commissioning processes (no string voltage testing required) and dramatically reduced troubleshooting time for any post-installation performance issues.
How do I calculate the actual ROI for a specific microinverter installation?
Use this framework: first, determine the annual production gap (microinverter projected kWh − string inverter projected kWh at the specific site). Multiply by the local retail electricity rate to get the annual savings value. Multiply by 25 (system life in years) to get the lifetime savings. Subtract the net after-ITC cost premium for microinverters. The result is the net lifetime value of choosing microinverters. For most shaded residential sites, this calculation yields $3,500–$12,000 in net lifetime value above the cost premium.
Can microinverters be used with battery storage systems?
Yes, and this represents one of the most significant growth opportunities in the market. Hybrid microinverter platforms integrate solar production, battery storage charging, and home energy management in a unified architecture. For homeowners seeking grid independence, backup power, or time-of-use rate optimization, a hybrid microinverter system addresses all three goals. Distributors who establish expertise in hybrid microinverter plus storage configurations are positioning themselves for the fastest-growing residential solar product category of the next five years.
What’s the best way to train my sales team to confidently sell microinverter solutions?
Combine technical product training with real-world case study immersion and ROI demonstration practice. Provide your team with the case studies in this guide adapted for your specific market, a live ROI calculator they can use with customers, role-playing scenarios based on real customer objection patterns, and direct access to monitoring platform demonstrations so they can show — rather than just describe — what panel-level data looks like. The most effective accelerator is pairing new team members with your top microinverter salespeople for joint customer visits during the first 30 days. Observed real selling conversations outperform classroom training by a significant margin.
This guide was developed for solar distributors, agents, and system integrators by the technical team at Jia Mao BIPV. For distributor partnership inquiries, product specifications, and regional market support, visit www.jmbipvtech.com.