PV Glass Curtain Wall: Turn Facades Into ROI Assets

A photovoltaic facade on a municipal building in Madrid. Photo: Hanjin, CC BY-SA 3.0, via Wikimedia Commons.
Quick answer: A PV glass curtain wall uses glass with solar cells laminated inside it as the building’s outer skin. It keeps out wind and rain like normal glazing, and it also makes electricity. You pay more than for standard glass up front. The extra cost shrinks when you subtract the glazing you no longer buy. Whether the project pays back in 4 years or 30 depends mostly on three numbers: net extra cost, annual yield, and your power price. The worked model in Section III shows how.
I. The Shift from Passive Envelopes to Active Energy Assets
For decades, a curtain wall had one job. It kept the weather out and looked good doing it. It sat on the budget as a cost center, and the best outcome was “no leaks.”
That is changing. The U.S. Department of Energy describes building-integrated photovoltaics (BIPV) as solar products that replace conventional materials in roofs, skylights, awnings, facades, or windows. A curtain wall is a non-structural outer wall, usually aluminum framing with glass infill. When that infill is PV glass, the wall becomes a power source.
The cost-center vs. profit-center shift
Think about a 30-story office tower. The roof is small and already crowded with chillers, lift motors, and window-cleaning gear. The facade is huge and gets sun all day. Putting the energy source on the facade solves a space problem that rooftop solar cannot.
| Passive curtain wall | PV glass curtain wall | |
|---|---|---|
| Main job | Weather barrier and appearance | Weather barrier, appearance, and power |
| Budget view | Cost center | Cost center that earns back part of its cost |
| Owner gets | A finished envelope | An envelope plus an on-site energy asset |
| Contractor bid | Compared on price per m² | Compared on lifecycle value |
Why this matters now
The market is moving fast. Precedence Research estimates the global BIPV market at USD 34.78 billion in 2025, growing to USD 250.91 billion by 2035 (a 21.85% yearly growth rate). The glass segment is expected to grow at about 21.6% a year.
Source: Precedence Research.
Who gains what
Each role in the project team sees a different benefit:
- Curtain wall and roofing contractors can offer an envelope package with energy built in, instead of competing only on glazing price.
- PV EPCs and energy service providers get access to facade area they could never use with racks.
- Architects, consultants, and design institutes keep control of color, transparency, and pattern, and still meet energy targets.
- Building material brands and distributors can sell a system with data behind it, not just a product.
At Jia Mao Bipv, the projects that go smoothest are the ones where the glazing contractor, the electrical team, and the designer sit in the same meeting before the shop drawings are issued. This guide follows that same logic.
II. Technical Integration: Seamlessly Merging Aesthetics with Energy Generation
High-performance PV glass removes the old trade-off between design intent and energy performance. You can choose the look and still get power.
How BIPV fits into a standard curtain wall
PV glass is made like other laminated architectural glass. Solar cells sit between two glass sheets, bonded with a clear polymer layer (called an interlayer). The finished unit drops into a normal curtain wall frame, either as a stick-built or a unitized (factory-assembled) panel.
The IEA PVPS technical guidebook (a free, open-access book from the International Energy Agency) includes more than 50 annotated drawings for roofs, shadings, rainscreens, curtain walls, and double-skin facades. It also lists IEC 63092 as the first international standard for BIPV products.
Our own curtain wall design guide walks through the same decisions from the supplier side.
Balancing transparency, U-value, and shading
Three numbers decide how a PV glass unit behaves inside the building:
- VLT (visible light transmittance): the share of daylight that passes through.
- SHGC (solar heat gain coefficient): the share of the sun’s heat that gets in. Lower means less cooling load.
- U-value: how fast heat leaks through the glass. Lower is better.
Notre transparent BIPV glass page lists VLT options from 30% to 90%, an SHGC range of 0.15 to 0.45, and cell coverage of 15% to 50% of the glass area. Those are manufacturer figures, so ask for whole-unit test reports on your exact build-up.
A simple rule works well in practice:
| Facade zone | Best PV glass choice | Why |
|---|---|---|
| Spandrel (opaque band between floors) | Opaque PV glass with dense cells | No daylight needed, so use the full power density |
| Vision glass at desks | Semi-transparent, about 30–40% VLT | Keeps daylight and cuts glare |
| Upper floors and parapets | Opaque or tinted PV glass | Best sun exposure, least shading |
| Atriums and canopies | Laminated safety PV glass | Overhead glass needs safety glazing |
For color-sensitive facades, our colored BIPV glass uses fired ceramic pigment. The product page states 30-year color retention with a color drift (ΔE, a number for how different two colors look) below 3.
Industry insight: The most common design mistake is treating the whole facade the same. Put dense, high-power glass in spandrels and use lighter cell layouts only where people need daylight. Our own review notes that opaque solar cladding produces roughly two to three times more power per m² than semi-transparent glass.
Material compatibility and structural needs
Specialized contractors should check four things before ordering:
- Glass build-up: PV glass is heavier than a standard double-glazed unit. Confirm dead load with the structural engineer.
- Thermal movement: aluminum expands more than glass. Details are in the table below.
- Edge seals and sealants: use only sealants the module maker approves.
- Cable routes: every wire through a mullion is a possible leak path.
| Matériau | Expansion per meter, per 1°C (typical) | Growth on a 1.5 m piece over a 60°C swing |
|---|---|---|
| Aluminum frame | about 23 × 10⁻⁶ | about 2.07 mm |
| Soda-lime glass | about 9 × 10⁻⁶ | about 0.81 mm |
| Difference to absorb | about 1.26 mm |
That 1.26 mm gap is why gaskets and slotted anchors matter. Our guide to BIPV glass integration for specialized contractors covers these interface details.
For fire safety, do not stop at the module certificate. UL notes that BIPV products must be evaluated as building materials too, with fire, impact, and wind tests on top of the electrical ones. Insurer FM ran large-scale tests and found that existing module fire ratings did not reliably predict full-facade fire behavior. Ask for test data on the whole assembly: glass, cavity, insulation, cables, and mounting.
III. The Economics of Installation: CAPEX vs. OPEX Analysis
The material costs more up front. Over its life, the numbers can come out well ahead, but only if you compare the right things.
Offsetting traditional glazing: the “net cost” of PV glass
Do not compare PV glass to nothing. Compare it to the glass you would have installed anyway, plus the rooftop solar you would have added.
Notre ROI guide for EPC contractors puts it this way: the headline premium of 200–300% over standard glass often shrinks to a net uplift of about 30–60% above standard high-performance glazing, before incentives. Treat that as a starting range, not a promise.
Operating costs: what on-site power does
Once the facade is running, it cuts the electricity you buy. That lowers OPEX (operating expenditure, the ongoing cost of running the building). Our guide estimates a south-facing facade yields about 80–150 kWh per m² per year, which means 160,000–300,000 kWh a year on a 2,000 m² wall.
A worked example: payback and long-term return
Here is a simple model for a 2,000 m² facade. Assumptions: high-performance glazing costs USD 400 per m². Electricity is priced as shown. The table ignores degradation, incentives, maintenance, and tariff growth, so use it for comparison only.
| Input or result | Cautious case | Base case | Strong case |
|---|---|---|---|
| Net extra cost vs. standard glazing | 60% (USD 240/m²) | 45% (USD 180/m²) | 30% (USD 120/m²) |
| Net extra cost, 2,000 m² | USD 480,000 | USD 360,000 | USD 240,000 |
| Yield (kWh per m² per year) | 80 | 100 | 150 |
| Annual output (kWh) | 160,000 | 200,000 | 300,000 |
| Power price (USD per kWh) | 0.10 | 0.15 | 0.20 |
| Annual energy value | USD 16,000 | USD 30,000 | USD 60,000 |
| Simple payback | 30 ans | 12 ans | 4 years |
| 25-year energy value minus extra cost | -USD 80,000 | +USD 390,000 | +USD 1,260,000 |
You can paste this table into Excel and swap in your own area, yield, and tariff. The formula is:
Illustrative model. Inputs are assumptions, not guarantees.
Payback and IRR for building owners
Owners often ask for IRR (internal rate of return, the yearly return that makes the investment break even over time). To get it, list the cash flows year by year: the net extra cost in year 0, then energy savings, maintenance, any inverter replacement, and degradation. Our BIPV evaluation framework shows how to structure that model.
Industry insight: In the table above, power price and yield move the result far more than the glass price does. The same facade pays back in 4 years in a high-tariff, sunny market and 30 years in a cheap-power market. Always show the owner a range, not a single number.
IV. Driving Property Valuation and Asset Appreciation
Energy-generating facades raise how a building is positioned in the market. Investors and tenants are starting to price energy performance directly.
What the rating systems add
LEED awards points across energy, materials, and other categories, with levels from Certified (40+ points) to Platinum (80+). BREEAM is the UK-born equivalent used around the world. The WELL certification focuses on occupant health, including light.
CBRE’s global ESG survey found real money behind this. LEED-certified U.S. office buildings earn about a 3.7% rent premium after controlling for age, size, renovation, and location. In Europe, offices with sustainability certifications earn about 5.5%. Of the respondents surveyed, 84% said features that reduce energy use affect their real estate decisions, and more than half would pay a premium for on-site renewable generation. See the full CBRE environmental features report.
A quick rent example
Assume a building with 10,000 m² of leasable space at USD 250 per m² per year. That is USD 2.5 million in annual rent. A 3.7% premium would be about USD 92,500 per year. That premium comes from the whole certified building, and solar glass is only one contributor. Still, it shows why owners pay attention.
| Value source | Example annual effect |
|---|---|
| Energy savings (base case, Section III) | USD 30,000 |
| Certification rent premium (3.7% example) | USD 92,500 |
| Lower risk of “brown discount” at sale | Hard to price, but real |

The solar facade of Copenhagen International School. Photo: Marta Victoria, CC BY-SA 4.0, via Wikimedia Commons.
Attracting corporate tenants
Large occupiers now report building emissions in annual statements. A facade that shows live energy data gives them a number they can use. This is why design teams increasingly add a visible production display in the lobby.
Future-proofing against the “brown discount”
A “brown” building is an inefficient one that may need costly upgrades to meet future rules. Buyers already discount these assets. A building that makes its own power is less likely to land in that group.
V. Navigating Carbon Compliance and Regulatory Mandates
PV glass gives a concrete route to meeting tighter carbon rules. The rules are moving in one direction.
Strategies for Net-Zero Energy (NZE) buildings
The European Commission states that the recast Energy Performance of Buildings Directive requires zero-emission buildings from 1 January 2028 for buildings owned by public bodies and from 1 January 2030 for all other new buildings. The small amount of energy still needed must be covered by on-site or nearby renewable sources.

A BIPV facade delivered in Norway. Photo: Sipetro, CC BY-SA 4.0, via Wikimedia Commons.
A practical NZE path has four steps:
- Cut demand first with insulation, good glazing, and shading.
- Use roof area for solar where it fits.
- Add PV glass on the best facade zones to close the gap.
- Cover the rest with storage or nearby renewables.
Carbon credits and subsidies
Incentives differ by country and change often, so do not build a business case on one that may expire. List each incentive separately in the model, and show the project result with and without it. If the project only works with the subsidy, say so clearly.
Avoiding “stranded assets”
A stranded asset is a building that loses value because it no longer meets the rules. Specifying energy generation at design stage is cheaper than a retrofit in year ten. That is a strong point when you talk to developers.
VI. Operational Efficiency: Reducing Grid Dependency and Peak Load
On-site generation steadies energy costs and eases the load on the building’s electrical system.
Peak shaving
Many commercial tariffs charge a “demand charge,” based on the highest power draw in a billing period. Reducing that peak, called peak shaving, can save money. Here is an example. If PV glass lowers the billed peak by 60 kW at USD 12 per kW per month, the saving is:
Vertical east and west facades produce more in the morning and late afternoon than a south roof does. That can line up well with office load, but check your own tariff and load profile.
Pairing with battery storage
A battery energy storage system (BESS) stores midday surplus for later use. It helps most where demand charges are high or where grid power is unreliable. Size the battery after you know the facade’s yield.
Smaller transformers and cables
When more power is made near where it is used, the building may need less grid capacity. Check this early, because utility upgrades can add months to a schedule.
Wiring without big losses
Long cable runs lose energy as heat. Use this formula to check voltage drop:
In this formula, L is one-way cable length in meters, I is current in amps, ρ is copper resistivity (about 0.0172 Ω·mm²/m), A is cable cross-section in mm², and V is system voltage. For 60 m, 10 A, a 6 mm² cable, and a 600 V string, the drop is about 3.4 V, or 0.57%. A common target is to stay below 1–2%. For layout and connectors, see our wiring and electrical integration guide.
VII. The Contractor’s Edge: Expanding Service Offerings and Competitive Advantage
For general and specialized contractors, PV glass opens new revenue and sets you apart from competitors who only quote glass.
From commodity glazing to energy solution provider
When every bid is a price-per-m² contest, margins shrink. A bid that includes yield estimates, a commissioning plan, and a monitoring handover is hard to compare with a plain glazing quote. Our guide on the benefits of solar energy glass for curtain wall contractors outlines how to build that package.
Turnkey delivery: glazing plus EPC
The cleanest projects split work clearly between the curtain wall team and the electrical EPC. A responsibility matrix like this helps:
| Task | Glazing contractor | EPC / electrical |
|---|---|---|
| Frame, glass setting, sealing | Owns | Reviews |
| Conduit sleeves through mullions | Installs | Specifies route and size |
| Module wiring and junction boxes | Gives access | Connects and records |
| String tests and commissioning | Assists | Owns |
| Post-wiring watertightness check | Owns | Reviews |
| Monitoring setup and handover | Supports | Owns |

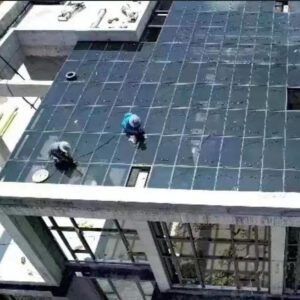
Photo: Nenad Stojković, CC BY 2.0, via Wikimedia Commons.
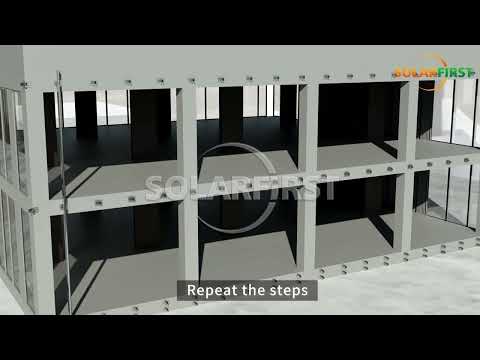
This video from Solar First Group shows a standardized BIPV curtain wall installation sequence, which is useful for crew briefings:
Winning more projects
You win more bids when you answer the owner’s real question: “What do I get for the extra cost?” Bring three things to the meeting: a range-based payback table, a list of certificates for the exact build-up, and a clear warranty owner. Our solar power glass curtain wall overview can serve as a pre-read for clients.
Industry insight: A contractor’s first PV facade often earns little. The second and third earn more, because the crew knows the interfaces. Pick a simple first project, such as one elevation or one canopy, and use it as training.
VIII. Risk Mitigation: Addressing Durability, Maintenance, and Performance
Longevity and upkeep decide whether the financial case holds up over 25 years.
Degradation and warranties
Degradation is the slow yearly loss of power. A study cited in our warranty and maintenance guide found glass-glass modules degrade at about 0.3–0.4% a year, compared with 0.5–0.7% for glass-backsheet modules. At 0.4% a year, a module keeps about 90% of its power after 25 years.
Notre transparent glass page lists a 25-year linear power warranty guaranteeing 80% output, and our laminated glass lists 85% after 15 years. Read warranty terms closely. They usually cover power output and glass defects separately, and may not cover the cost of access, removal, and facade reinstatement.
Cleaning and maintenance
A facade needs the same access gear as a normal curtain wall: building maintenance units, rope access, or swing stages. Our review suggests budgeting two to three times the per-m² maintenance cost of rooftop solar because of access cost.
Soiling (dirt that blocks light) also costs energy. The U.S. national lab’s soiling map measures it across 255 sites and explains that a soiling ratio of 0.95 means 5% annual energy loss. Vertical glass tends to stay cleaner than flat roofs because rain runs off it, but city smog and coastal salt still build up.
A simple schedule works for most projects:
| Task | Frequency |
|---|---|
| Review monitoring dashboard | Monthly |
| Visual check from ground or BMU | Quarterly |
| Clean glass | Twice a year, more often near roads, industry, or the sea |
| Inspect sealants and joints | Every 3–5 years, or sooner after storms |
| Electrical inspection | Every 2–3 years |
Use soft brushes and clean water. Avoid high-pressure washers and harsh chemicals, because they can damage coatings and seals.
Smart monitoring
Install monitoring at module-group level, not just at the inverter. Then a drop in one string shows up quickly. Compare output against expected yield for the actual weather, and set alerts at about 10% below expectation. The IEA guidebook notes that a performance ratio above 74% is achievable for well-designed BIPV systems. Use that as a sanity check.
For certification review before purchase, see our guide to verifying solar glass certifications.
IX. Strategic Procurement: Optimizing the Supply Chain for BIPV
Good sourcing keeps the schedule and the margin intact. Poor sourcing is where most PV facade delays start.
Choosing a PV glass brand
Compare suppliers on the same checklist:
| Criterion | What to ask for |
|---|---|
| Efficiency and yield | Test data for your cell layout and VLT, not a catalog number |
| Apparence | A full-size sample outdoors, plus a ΔE tolerance |
| Reliability | Certificates for the exact product build-up and the expiry date |
| Sécurité | Tempered or laminated glass details, and impact classification |
| Assistance | BIM objects, structural calculations, and yield simulations |
| Garantie | One written document that names who pays for replacement |
Notre solar glass types guide et 2026 facade systems review compare options in more depth. For safety glazing, see our verre feuilleté trempé specification.
Handover between distributor and installer
Breakage on arrival and unclear receiving rules cause many disputes. Agree on these before shipping:
- Packaging method and crate labeling by facade zone.
- Inspection on delivery, with photos, within a set number of days.
- Storage rules on site (flat or vertical, covered, off the ground).
- A named person who signs for the delivery.
Lead times and custom shapes
Custom sizes, colors, and curved or non-standard shapes add time. Ask for lead times in writing and order long-lead items early, at about 30–40% design completion. Keep spare modules from the same production batch, because colors can differ between runs.
Industry insight: Treat the supplier as a design partner. The best time to involve them is before the module grid is fixed. A grid that matches standard glass sizes can cut waste and lead time.
X. The Future of Urban Architecture as a Power Plant
The shift to PV glass is not a passing trend. Rules, tenants, and energy prices are all pushing in the same direction.
What the numbers say
- Return: payback can range from about 4 to 30 years depending on net cost, yield, and tariff. Model it, don’t guess.
- Compliance: the EU requires zero-emission new buildings from 2028 for public bodies and 2030 for the rest.
- Value: certified buildings earn rent premiums, around 3.7% in LEED-certified U.S. offices and 5.5% in certified European offices.
What to do next
Bring the facade team, the EPC, and the supplier together at concept stage. Request samples and test reports for your exact build-up. Run the payback table with your own numbers. If you want help, contact the Jia Mao team with your elevations, target transparency, and location, and we will help you build the first estimate.
The longer view
A city block of PV glass facades behaves less like a group of energy users and more like a distributed power plant. The projects that plan for this today will be the benchmark for the next decade.
Glossary: Key Terms in Plain English
| Term | Plain meaning | Example |
|---|---|---|
| BIPV | Solar built into a building material | A solar glass panel that is the curtain wall glazing |
| BAPV | Solar added on top of a finished building | Racked panels on a roof |
| VLT | Share of daylight that passes through glass | 30% VLT lets in about a third of daylight |
| SHGC | Share of solar heat that enters | Lower is better in hot climates |
| Valeur U | How fast heat leaks through; lower is better | A low-E double unit beats single glass |
| ΔE | A number for how different two colors look | Below 3 is hard to see |
| CAPEX / OPEX | Up-front cost / ongoing running cost | Glass purchase / electricity bills |
| IRR | Yearly return that makes an investment break even | A 10% IRR over 25 years |
| Peak shaving | Lowering the highest power draw in a billing period | Cutting a 400 kW peak to 340 kW |
| Demand charge | A fee based on the peak power draw | USD per kW per month |
| BESS | Battery system that stores electricity | A battery that holds midday surplus |
| Stranded asset | A building that loses value because it fails new rules | An inefficient tower in a zero-emission market |
| Verre feuilleté | Two glass sheets bonded by a polymer layer; fragments stay stuck on breakage | Safety glazing for overhead use |
Questions fréquemment posées
1. How does the cost per square meter of PV glass compare to high-end triple-glazed units?
PV glass costs more per m² than standard glass. Our guide notes the headline premium can be 200–300%, but the net extra cost often narrows to about 30–60% above high-performance glazing once you remove the cost of the glass and rooftop solar you no longer buy. Triple-glazed units already carry a premium, so the gap is smaller than many expect. Ask for quotes on the same frame and size, and include electrical work.
2. What is the typical degradation rate of BIPV glass over a 25-year lifecycle?
Glass-glass modules typically degrade about 0.3–0.4% per year, which means about 90% of the original power remains after 25 years. Product warranties often guarantee at least 80% at year 25. Real results depend on heat, moisture, and installation quality. Ventilated cavities help because heat speeds up aging.
3. Can PV glass be integrated into existing curtain wall systems during a retrofit, or is it only for new builds?
It can be used in retrofits, but new builds are easier. A retrofit needs checks on anchor capacity, glass weight, electrical routes, fire barriers, and how to replace glass without disrupting tenants. Unitized replacement panels and phased work on one elevation at a time often make retrofits practical.
4. How do you calculate the exact ROI when accounting for both energy savings and tax incentives?
Start with net extra cost compared with the glazing you replace. Subtract any incentive that you can document. Then divide by annual savings, as in the payback formula in Section III. For a fuller view, build a year-by-year cash flow with degradation, maintenance, inverter replacement, and tariff growth, then calculate IRR. Incentive rules change, so show results with and without them.
5. What are the specific electrical safety requirements for integrating PV cells into a facade?
Requirements vary by country, but common items include certified modules (IEC 61215 and IEC 61730), BIPV-specific testing (IEC 63092 or UL 7103), proper grounding, protected cable routes, labeled disconnects, and rapid shutdown where required (such as NEC 690.12 in the U.S.). Have the electrical engineer and the facade engineer sign the same drawing set.
6. How does the transparency or tint of PV glass affect the Daylight Autonomy (DA) of the interior space?
Daylight autonomy is the share of occupied hours when daylight alone gives enough light. Lower VLT lowers daylight autonomy. Office vision zones commonly use about 30–40% VLT, with denser cells in spandrels and parapets. Run a daylight simulation for each floor and orientation before fixing the cell spacing.
7. Which certifications (LEED, BREEAM) provide the most significant points for BIPV integration?
The largest benefit usually comes from the energy and carbon categories, such as LEED’s energy performance and renewable energy credits, and BREEAM’s energy and low-carbon design credits. Daylight and material credits may help too. Point values change by version, so confirm with your assessor early.
8. How is the thermal expansion of PV glass managed compared to traditional insulating glass?
The same way: with movement gaps, slotted anchors, and flexible gaskets. Aluminum frames grow more than glass, about 1.26 mm more on a 1.5 m piece over a 60°C swing. Add the extra heat from PV cells, and the design needs room for movement. Use sealants approved by the module maker.
9. What happens to the energy yield in high-density urban areas with significant overshadowing?
Yield drops, and not only in proportion to the shaded area, because shade on one cell can limit a whole string. Use a time-series shading study, group modules by shade pattern, and use microinverters or DC optimizers where shade is uneven. Concentrate PV on upper floors and unshaded elevations.
10. Who carries the warranty for the system: the glass manufacturer, the curtain wall contractor, or the EPC provider?
Usually all three carry part of it. The manufacturer covers product defects and power output, the glazing contractor covers installation and watertightness, and the EPC covers electrical work. Gaps appear at the boundaries. The cleanest approach is one written responsibility matrix, plus a clear statement of who pays for access, removal, and reinstatement.
11. How does PV glass perform in extreme climates (high heat or freezing temperatures)?
Heat lowers power. Product pages list temperature coefficients from about -0.29% to -0.4% per °C, so a module 30°C above test temperature loses roughly 9–12%. Ventilation helps. Cold raises voltage, by about 11% at -20°C using a -0.25%/°C voltage coefficient, so check your string design at the coldest expected temperature. Hail ratings and operating range (-40°C to +85°C on our product pages) should match the site.
12. What is the most efficient way to wire a large-scale BIPV facade to minimize voltage drop?
Use properly sized cable, keep runs short, and place inverters close to the arrays. Group modules with the same sun and shade, and keep voltage drop below about 1–2% using the formula in Section VI. Plan routes through mullions or a service cavity at design stage, and keep junction boxes reachable for maintenance.