A Comprehensive Cost-Benefit Analysis for Contractors and Developers Weighing Building-Integrated Photovoltaics Against Conventional Roofing Solutions, with Real ROI Scenarios for Renovation Projects
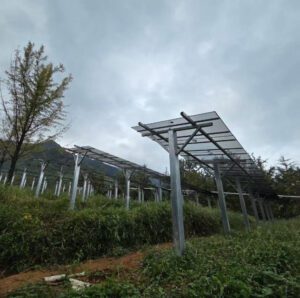
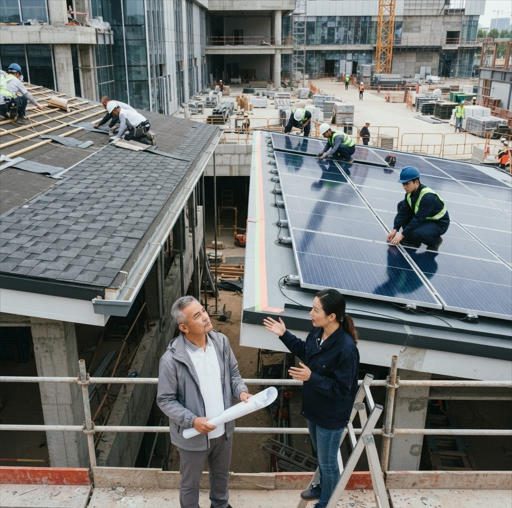
 A modern commercial building using BIPV roofing — where the roof generates revenue while protecting the structure. Source: Unsplash
Why This Comparison Matters for Your Business in 2025
If you’re still pitching roofing projects purely on materials and labor, you’re leaving margin — and clients — on the table.
The roofing market has quietly crossed a threshold. In 2025, the global BIPV market is valued at approximately $34.78 billion, and independent research from Precedence Research projects it will reach $250.91 billion by 2035 — a staggering compound annual growth rate of roughly 22% per year. That’s not a niche technology story. That’s a structural shift in how your clients think about every roof they build or replace.
Your clients — developers, building contractors, commercial property owners — are being squeezed from both ends. Energy costs are climbing. ESG reporting requirements are tightening. Institutional tenants are asking pointed questions about energy performance before signing leases. When a contractor or distributor walks into the room with a BIPV proposal that converts a cost center (the roof) into a revenue-generating asset, the conversation changes entirely.
This guide exists to arm you with the financial intelligence to lead that conversation with confidence.
How to Use This Guide
This article is built for professionals who win business through expertise, not price wars. You’ll find detailed cost comparisons, four real-world ROI scenarios for renovation projects, financing frameworks, and a decision-making model you can apply to your next proposal. Each section ends with actionable intelligence you can use in front of a client or developer next week.
Bookmark the ROI scenario tables (Section 5). Share the FAQ section with clients who ask basic questions. Use the cost comparison in Section 6 to frame your financial presentations. This is your working document.
1. Understanding BIPV Technology: What Makes It Different
What Exactly Are Building-Integrated Photovoltaics?
Building-Integrated Photovoltaics (BIPV) refers to photovoltaic materials that are embedded directly into the building envelope itself — replacing, not supplementing, conventional building materials such as roof tiles, facade cladding, glass panels, or metal roofing sheets. Unlike traditional rooftop solar, where panels are mounted on a rack above an existing roof surface, BIPV is the roof, the wall, or the window.
The distinction matters enormously for your cost analysis. A BIPV roof tile is simultaneously performing two jobs: weather barrier and power generator. This dual function fundamentally changes the math. You’re not paying for solar on top of a roof — you’re paying for a roof that earns.
The core components of a BIPV system include: the photovoltaic building material itself (tile, glass module, or metal panel), a grid-tie inverter that converts DC electricity to usable AC power, a monitoring system for production tracking, and the interconnection to the building’s electrical system or the utility grid.
How BIPV Differs Fundamentally from Traditional Rooftop Solar
Traditional rooftop solar (often called BAPV — Building-Applied Photovoltaics) lays rack-mounted panels over an existing, finished roof. That means you’re paying for two separate systems: the roof itself and the solar array on top. BIPV eliminates this redundancy. The photovoltaic element replaces the weather-protective layer entirely.
The practical consequence: when you compare costs, you must net out the avoided cost of the conventional roofing material BIPV replaces. Failing to account for this is the single most common mistake contractors make when presenting BIPV economics to clients.
Types of BIPV Solutions Available in 2025
The BIPV product landscape in 2025 has matured considerably. Where once only a handful of expensive products existed, distributors now have a genuine menu of solutions to match different project types, budgets, and aesthetic requirements.
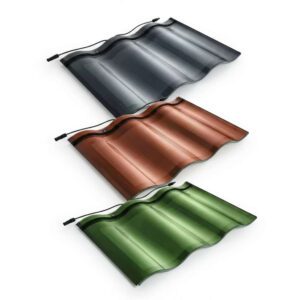
- BIPV Solar Tiles and Shingles: Individual photovoltaic units designed to mimic the appearance of clay tile, slate, or asphalt shingles. Best suited for premium residential properties, boutique hotels, and high-visibility commercial roofs. Price range: $2.50–$8.00/W installed.
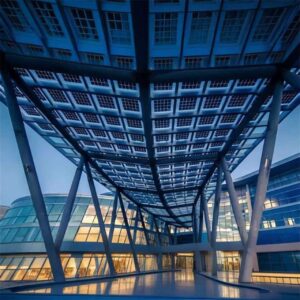
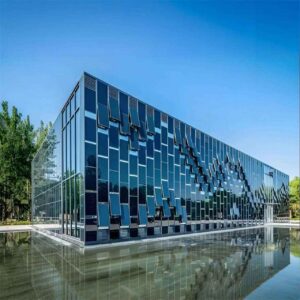
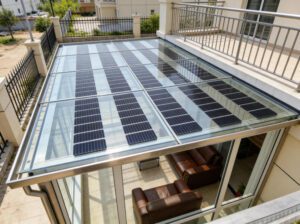
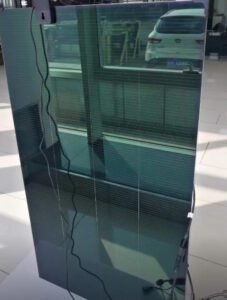
- BIPV Glass and Transparent Photovoltaic Systems: Semi-transparent glass modules integrated into skylights, atriums, curtain walls, and building facades. These provide daylight, thermal shading, and electricity simultaneously. The visible light transmission (VLT) — the percentage of daylight that passes through — can be specified from 10% to 90%, allowing architects to balance aesthetics and power output. Price range: $250–$1,000/m².
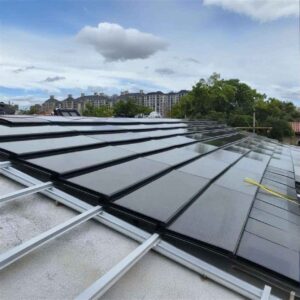
- BIPV Metal Roofing Solutions: Photovoltaic laminates bonded to standing-seam metal roof panels. Particularly effective on large commercial and industrial roofs where aesthetics are secondary to output and durability. Price range: $1.50–$4.00/W.
- Thin-Film and Flexible BIPV Alternatives: Lightweight, flexible PV films applied to curved or irregular surfaces. Emerging technology with growing applications in retrofits where structural load constraints prevent heavier systems.
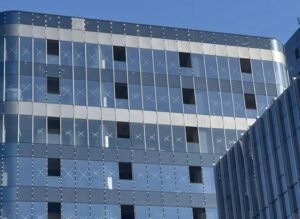
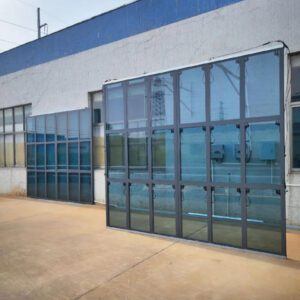
 BIPV glass in a commercial curtain wall — daylight, thermal performance, and electricity generation in a single product. Source: Unsplash
Market Adoption Trends
The growth story isn’t uniform. European markets — particularly Germany, the Netherlands, and France — are leading commercial BIPV adoption, driven by stringent energy codes mandating near-zero energy buildings. In the United States, the Northeast and Pacific Coast states are the primary growth markets, incentivized by both utility-scale net metering policies and state-level clean energy mandates. Commercial BIPV installations are growing faster than residential, with industrial warehouse and logistics center roofs emerging as particularly high-volume deployment targets due to large, unobstructed roof planes and significant electricity demand.
For distributors and contractors, the regional opportunity map matters. High electricity rates + strong incentive programs + large commercial roofing activity = your target geography.
2. Traditional Roofing: The Baseline for Comparison
Standard Roofing Materials and Their Properties
Before the financial comparison can be meaningful, you need accurate 2025 baseline costs for conventional roofing — the number your clients are currently using as their default option.
Asphalt shingles remain the most common residential and low-rise commercial roofing material in North America. Material cost runs $0.80–$2.00 per square foot, with installed costs (including labor) of $4.50–$8.00/sq ft for standard quality. Typical lifespan is 20–30 years, with major repairs or full replacement commonly needed at the 15–20 year mark in harsh climates. Maintenance is relatively simple but unavoidable — granule loss, flashing failures, and UV degradation compound over time.
Metal roofing has gained significant market share in the commercial sector due to its superior lifespan (40–70 years for standing-seam systems) and lower long-term maintenance burden. Installed costs range from $8.00–$40.00/sq ft depending on panel style, metal type (galvalume, aluminum, copper), and roof complexity. Standing-seam systems command a premium but provide the cleanest integration with BIPV laminates — making metal roofing the natural transition pathway for many commercial clients considering BIPV.
Tile and slate represent premium traditional options. Clay tile installations run $12–$25/sq ft installed; natural slate can reach $15–$30/sq ft. These materials can last 50–100 years but require specialized installation labor and periodic maintenance for cracked or slipped tiles.
Current Pricing Structure for Conventional Roofing (2025)
| Roofing Type | Material Cost ($/sq ft) | Installed Cost ($/sq ft) | Typical Lifespan | Replacement Cycle |
|---|---|---|---|---|
| Asphalt Shingles (3-tab) | $0.80–$1.50 | $4.50–$6.50 | 20–25 years | 1–2 times in 50 years |
| Asphalt Shingles (Architectural) | $1.50–$2.00 | $6.00–$8.50 | 25–30 years | 1–2 times in 50 years |
| Metal Roofing (Exposed fastener) | $1.00–$4.00 | $8.00–$14.00 | 30–45 years | 1 time in 50 years |
| Metal Roofing (Standing seam) | $3.00–$6.00 | $14.00–$28.00 | 40–70 years | 0–1 times in 50 years |
| Clay/Concrete Tile | $2.00–$6.00 | $12.00–$22.00 | 40–50 years | 0–1 times in 50 years |
| Natural Slate | $4.00–$12.00 | $15.00–$30.00 | 75–100 years | 0 times in 50 years |
Source: National pricing averages, 2025. Regional labor rates vary by ±20–30%.
Expected Lifespan and Replacement Cycles
The replacement cycle cost is where traditional roofing loses its apparent price advantage over long hold periods. A commercial property owner with an asphalt shingle roof is typically looking at two full roof replacements over a 50-year period — plus ongoing maintenance. A metal roof owner is looking at one replacement, if any. When you present BIPV, you must include the client’s realistic ownership horizon and replacement assumptions. A BIPV system with a 25-30 year warranted lifespan and zero re-roofing costs over that period changes the 25-year total cost of ownership (TCO) calculation dramatically.
3. BIPV Installation Costs: Breaking Down the Numbers
Initial Capital Investment for BIPV Systems
The upfront cost of BIPV is real, and your clients will ask about it immediately. Here is the transparent breakdown:
For commercial BIPV roofing installations, material costs for the photovoltaic modules themselves typically run $1.80–$3.00/W for standard glass-glass or metal-integrated BIPV panels. For premium solar tiles or architectural glass applications, this rises to $2.50–$8.00/W. Installed system costs — including electrical balance-of-system (BOS: inverters, cabling, connectors, monitoring), labor, and roofing integration — range from $3.50–$8.50/W depending on system type, roof complexity, and regional labor rates.
On a per-square-foot basis, a mid-range commercial BIPV roofing system runs approximately $20–$45/sq ft installed before incentives.
For context: a standard commercial standing-seam metal roof runs $14–$28/sq ft installed. The BIPV premium over premium metal roofing is real but narrower than many contractors assume — and before the 30% federal tax credit is applied.
Premium Pricing Analysis
BIPV costs more upfront than traditional roofing for three primary reasons. First, the manufacturing complexity of integrating photovoltaic cells into building-grade materials — meeting both roofing standards (waterproofing, wind uplift, fire resistance) and PV standards (cell efficiency, encapsulation durability, electrical safety) — requires sophisticated production processes. Second, market scale is still growing; as volumes increase, per-unit costs continue to decline. Third, installation requires both licensed roofing expertise and licensed electrical expertise working in coordination — a higher labor cost than either discipline alone.
However, the cost trajectory is firmly downward. BIPV manufacturing costs have declined approximately 15–20% over the past three years, tracking the broader solar industry’s learning curve. Companies like Jia Mao BIPV — with annual production capacity of 3 GW and fully automated manufacturing lines — are driving this cost compression at the supply chain level, translating directly to better margins for distributors and more competitive project economics for end clients.
Hidden Costs Contractors Should Know About
Transparent client presentations require acknowledging these additional line items:
Electrical infrastructure upgrades are frequently necessary in older commercial buildings — service panel upgrades, additional disconnect switches, rapid-shutdown compliance equipment, and utility interconnection fees can add $5,000–$25,000 to a commercial project. Battery storage integration, if specified by the client, adds $400–$800/kWh of capacity. For certain heavier BIPV panel types, structural engineering review and possible reinforcement adds engineering fees of $2,000–$8,000 on larger projects. Finally, installer certification: most major BIPV manufacturers require product-specific installation training. This is a real cost and timeline factor but also a competitive moat for distributors who invest in building certified installer networks.
4. The Revenue Generation Factor: Where BIPV Wins
Energy Production and Financial Returns
This is the section that changes conversations. A traditional roof costs money every year it exists — maintenance, eventual replacement. A BIPV roof earns money every year it generates electricity.
The annual energy production of a BIPV system is calculated using a straightforward formula:
Peak sun hours vary significantly by geography: Phoenix averages 6.0–6.5 peak sun hours daily; Atlanta averages 4.5–5.0; Chicago averages 3.5–4.0; Seattle averages 3.0–3.5. A conservative performance ratio of 0.78–0.82 accounts for temperature losses, wiring losses, inverter efficiency, and the 0.5% annual degradation rate typical of modern crystalline modules (confirmed by NREL data).
For a 100 kW commercial BIPV system in Atlanta (4.75 peak sun hours, 0.80 performance ratio):
At a commercial electricity rate of $0.12/kWh, this system generates $16,644/year in direct energy value — before net metering credits or demand charge reductions.
In high-rate states, the returns are substantially higher. California commercial rates averaging $0.22/kWh push that same system to $30,514/year in energy value.
 Solar resource availability varies significantly by geography — site-specific production modeling is essential for accurate client proposals. Source: Unsplash
Federal Tax Credits and Incentives (2025 Updates)
The Investment Tax Credit (ITC) is the single most powerful lever in your BIPV sales toolkit. At its current rate of 30% of total installed system cost (confirmed through 2034 under current federal law), the ITC reduces the effective cost of every commercial BIPV installation by nearly one-third.
On a $500,000 commercial BIPV project, that’s a $150,000 direct tax credit — not a deduction, a credit, dollar-for-dollar against federal tax liability. For commercial property owners with sufficient tax appetite, this credit can be monetized in year one. Owners with insufficient tax liability can partner with tax equity investors or utilize the IRS’s direct pay provision available to certain entities.
Additionally, commercial BIPV installations qualify for accelerated depreciation under MACRS (Modified Accelerated Cost Recovery System), typically allowing 5-year depreciation on the solar component. Combined with ITC, the year-one tax benefit of a commercial BIPV project routinely exceeds 40–45% of gross system cost.
For the residential market (relevant to multi-family property owners), the same 30% ITC applies through 2025, after which it is scheduled to step down. This creates a meaningful urgency argument for 2025 project starts.
Local and Regional Incentive Programs
Federal incentives are the floor, not the ceiling. Several states and utilities layer additional value onto commercial solar and BIPV projects:
Massachusetts SMART program pays performance-based incentives for the life of the system. New York’s NY-Sun Megawatt Block program offers capacity-based incentives for commercial installations. California’s SELF program and various utility net metering policies add value in the nation’s largest solar market. The DSIRE database is the definitive resource for identifying current incentives by state and utility territory — an indispensable tool for any BIPV distributor’s proposal development workflow.
The practical advice for distributors: become the regional incentive expert. When you can walk a developer through the exact incentive stack available on their specific project — federal ITC, state rebate, utility incentive, property tax exemption, and accelerated depreciation — you’re not selling a product anymore. You’re delivering a financial engineering service that no traditional roofing supplier can match.
5. Real ROI Scenarios: Renovation Projects
The following four scenarios use conservative assumptions: 2.5% annual electricity rate escalation, 0.5% annual system degradation, and 30% ITC applied in year one. All costs are in 2025 dollars.
Scenario 1: Mid-Range Commercial Building — 5,000 sq ft Roof
Profile: Two-story office building in Atlanta, GA. Roof due for replacement. Owner occupies building and pays commercial electricity rates.
Investment Breakdown:
| Line Item | Cost |
|---|---|
| BIPV Metal Roofing System (250 kW, $3.80/W installed) | $950,000 |
| Electrical Infrastructure Upgrades | $18,000 |
| Engineering and Permitting | $12,000 |
| Gross Project Cost | $980,000 |
| Less: 30% Federal ITC | -$294,000 |
| Less: Avoided Traditional Metal Roof Cost ($22/sq ft × 5,000 sq ft) | -$110,000 |
| Less: MACRS Depreciation Benefit (est. Year 1-2) | -$95,000 |
| Net Effective Investment | $481,000 |
Year-by-Year Cash Flow Projections (Key Years):
| Year | Annual Energy Value | Cumulative Net Savings | Running ROI |
|---|---|---|---|
| 1 | $41,600 | -$439,400 | — |
| 3 | $43,700 | -$350,100 | — |
| 5 | $45,900 | -$257,400 | — |
| 8 | $49,300 | -$109,900 | — |
| 10 | $51,700 | +$3,800 | Break-even |
| 15 | $58,200 | +$289,300 | +60% |
| 20 | $65,500 | +$614,200 | +128% |
| 25 | $73,700 | +$989,600 | +206% |
Electricity rate: $0.12/kWh base, 2.5% annual escalation. 250 kW system at 4.75 peak sun hours.
25-Year Total ROI Comparison:
Traditional metal roof (same 5,000 sq ft): $110,000 upfront, $8,500/year maintenance budget, no revenue generation. 25-year total spend: approximately $322,500. Zero return.
Scenario 2: Residential Multi-Family Property — 15 Units
Profile: 15-unit apartment complex in Phoenix, AZ. Flat TPO roof at end of life. Owner seeking to reduce operating costs and improve property value.
Investment and Returns:
| Line Item | Cost |
|---|---|
| BIPV Roofing System (75 kW) at $4.20/W | $315,000 |
| Electrical Upgrades and Metering | $22,000 |
| Gross Project Cost | $337,000 |
| Less: 30% ITC | -$101,100 |
| Less: Avoided TPO Roof Cost (~$9/sq ft × 3,500 sq ft) | -$31,500 |
| Net Effective Investment | $204,400 |
In Phoenix’s 6.0 peak sun hour environment, this 75 kW system generates approximately 131,400 kWh/year. At $0.115/kWh (Arizona commercial rate), annual energy value is $15,111. Monthly energy savings apportioned across 15 units: approximately $84/unit/month in common area electricity cost reduction, directly improving net operating income (NOI).
Break-even: approximately 11.5 years post-incentives.
Property value uplift: studies consistently show commercial income-producing properties command a premium for reduced operating expenses. A $15,000/year reduction in electricity costs, capitalized at a 6% cap rate, implies a $250,000 increase in property value — nearly equal to the net project cost in year one.
Scenario 3: Industrial Warehouse Renovation
Profile: 80,000 sq ft distribution center in New Jersey. Aging metal roof. Corporate sustainability mandate requiring 40% renewable energy by 2027.
This is where BIPV economics become genuinely compelling. Industrial roofs are large, unobstructed, and structurally sound — ideal for BIPV metal panel overlays or full standing-seam BIPV replacement.
| System Scale | 500 kW BIPV Metal Panel System |
|---|---|
| Gross Installed Cost ($3.50/W) | $1,750,000 |
| Federal ITC (30%) | -$525,000 |
| MACRS Year 1-2 Depreciation Benefit | -$175,000 |
| Avoided Roof Replacement Cost | -$160,000 |
| Net Effective Investment | $890,000 |
Annual energy production (NJ, 4.2 peak sun hours): approximately 532,000 kWh/year. At NJ commercial electricity rates averaging $0.16/kWh (with demand charge offsets), annual savings: approximately $85,120/year.
Beyond the financial return, this installation eliminates approximately 373 metric tons of CO₂ equivalent annually — a material ESG disclosure figure for corporate sustainability reports. For companies operating under GRESB or CDP frameworks, this translates into measurable scoring improvements that affect access to green capital.
The competitive advantage extends to tenant negotiations: major logistics tenants — Amazon, FedEx, UPS — increasingly require their landlord partners to demonstrate sustainability commitments. A BIPV-equipped facility commands stronger tenant relationships and, in many cases, premium lease terms.
Scenario 4: Mixed-Use Development Project
Profile: New mixed-use development — ground-floor retail, 4 floors of residential apartments. Total roof and facade area: 12,000 sq ft. Developer seeking to optimize total project financing.
Mixed-use projects offer the most sophisticated incentive stacking opportunity. The commercial component (retail and common areas) qualifies for the business ITC and MACRS depreciation. The residential component may qualify for state residential rebates. A single project can legitimately claim benefits from multiple incentive programs by properly allocating costs between commercial and residential portions.
| Component | System Size | Net Cost After Incentives |
|---|---|---|
| Commercial Retail + Lobby (BIPV Glass Facade) | 30 kW | $126,000 |
| Residential Roof (BIPV Metal Tiles) | 60 kW | $168,000 |
| Total System | 90 kW | $294,000 |
Annual energy value at $0.18/kWh blended rate: $46,656. Break-even: approximately 6.3 years — one of the shortest payback periods in any scenario, driven by high local electricity rates and aggressive incentive stacking.
The facade BIPV glass component also serves as premium architectural cladding, reducing conventional curtain wall material costs by approximately $35,000 — a benefit unique to BIPV integration that’s impossible to replicate with rack-mounted solar.
6. Cost-Benefit Analysis: The Complete Financial Picture
Direct Cost Comparison Over 25 Years
The most compelling way to present BIPV to a skeptical client is a lifecycle cost analysis — total cost of ownership (TCO) over 25 years, inclusive of all costs and all revenues.
| Cost Category | Traditional Roofing (Asphalt/Metal) | BIPV System |
|---|---|---|
| Initial Installation (5,000 sq ft) | $55,000–$140,000 | $475,000–$850,000 |
| Less: Federal ITC | $0 | -$142,500–$255,000 |
| Less: Avoided Material Cost | $0 | (already netted above) |
| Maintenance (25 years) | $25,000–$65,000 | $12,000–$28,000 |
| Replacement/Major Repair (25 years) | $55,000–$140,000 | $8,000–$15,000 (inverter) |
| Energy Savings Generated (25 years) | $0 | $350,000–$850,000+ |
| Net 25-Year Cost / (Benefit) | $80,000–$205,000 spent | Net positive: $50,000–$500,000+ |
Ranges reflect system size, location, and electricity rate variations. BIPV figures use conservative 2.5% electricity rate escalation.
The traditional roof is a sunk cost. BIPV is an investment with a measurable return. That reframing is the foundation of every successful BIPV sales presentation.
Non-Monetary Benefits of BIPV
The hard numbers make the financial case. The soft benefits close the deal.
Commercial properties with BIPV installations consistently achieve higher appraised values than comparable non-solar properties. A Lawrence Berkeley National Laboratory study found that solar installations add an average of $4.00–$5.00 per watt to commercial property values — entirely independent of energy savings calculations. For a 250 kW commercial system, that’s a $1.0–$1.25 million value uplift.
BIPV-equipped multi-family properties in major markets command rental premiums of 4–8% based on reduced utility costs and sustainability credentials — measurably impacting NOI and therefore capitalized property value. For developers and institutional property owners, this is not a marginal benefit. It’s a core valuation argument.
Risk Mitigation and Insurance Considerations
Quality BIPV systems come with 25-year product and performance warranties — typically guaranteeing 80% of rated power output at year 25. This warranty coverage is structurally superior to most traditional roofing warranties, which typically cover manufacturing defects for 10–30 years but do not guarantee performance under weather stress. BIPV modules engineered to building-grade standards — including wind uplift resistance of 4.0 kPa and B1-grade flame retardancy — can actually reduce insurance risk profiles for commercial properties.
Environmental Impact and ESG Value
A 100 kW BIPV system in an average US climate generates approximately 138,000–145,000 kWh annually, displacing approximately 97–102 metric tons of CO₂ per year based on the national average grid emission factor. Over 25 years, this represents a cumulative offset of approximately 2,425–2,550 metric tons — a meaningful and auditable ESG disclosure metric.
For property owners subject to GRESB assessments, SEC climate disclosure requirements, or corporate sustainability commitments, BIPV installations directly contribute to measurable decarbonization targets. As ESG-linked financing becomes mainstream, properties with documented carbon reduction programs access lower-cost capital — an indirect financial benefit that never appears in a simple ROI calculation but has real economic value.

7. Financing and Payment Options for BIPV Projects
Traditional Financing Approaches
The most straightforward path: the property owner finances the BIPV installation through a commercial mortgage, equipment loan, or line of credit. Interest rates for commercial solar projects in 2025 typically range from 6.5–9.0% depending on borrower creditworthiness and loan structure. The key advantage of ownership: the property owner captures 100% of the ITC, all MACRS depreciation, and all energy savings.
Commercial PACE (C-PACE) financing is particularly compelling for BIPV projects because it attaches to the property rather than the borrower. The EPA’s C-PACE program enables property owners to finance energy improvements with repayment through a property tax assessment — no balance sheet impact, no personal guarantee, and terms of 10–30 years. The C-PACE Alliance provides a state-by-state availability map and program details.
Specialized Solar Financing Solutions
Solar-specific loans through institutions like GreenSky, Mosaic, or Dividend Finance offer terms tailored to BIPV project cash flows — often structured with deferred payment periods that align with the ITC filing timeline. Power Purchase Agreements (PPAs) allow a third-party investor to own the BIPV system, take the ITC, and sell electricity to the property owner at a fixed rate below market — zero upfront cost for the property owner, immediate savings on day one. Energy Savings Agreements (ESAs) function similarly, with payments tied to measured energy savings rather than a fixed rate.
For distributors and contractors: your ability to present multiple financing pathways dramatically increases your close rate. The client who balks at a $500,000 capital expenditure becomes enthusiastic about a $0-down PPA delivering immediate cost savings. Partner with solar financing providers before your next major pitch.
Maximizing ROI Through Strategic Financing
The fastest break-even scenario: property owner takes a C-PACE loan (off balance sheet), applies ITC to year-one tax liability, uses MACRS depreciation to generate additional tax savings in years 1-5, and realizes positive cash flow from electricity savings from day one. In high-electricity-rate states with strong incentive programs, this structure can achieve positive net cash flow from year one — before the system is even paid off.
8. Installation, Maintenance, and Operational Costs
Installation Process and Timeline Differences
BIPV installation is more complex than traditional roofing — that’s a honest statement. A traditional commercial re-roofing takes 1–3 weeks for a 5,000 sq ft roof. A BIPV installation of similar scope takes 3–6 weeks, accounting for electrical work, inspections, and utility interconnection approval (which alone can add 2–6 weeks to project timelines in some utility territories).
This timeline differential matters for commercial clients managing tenant occupancy or construction sequencing. It’s not a disqualifier, but it requires honest project planning. The practical mitigation: start utility interconnection applications early — often before construction — to compress the overall timeline.
Ongoing Maintenance Requirements
BIPV systems require less physical maintenance than traditional roofing but add electrical system monitoring. Annual BIPV maintenance typically involves: automated production monitoring (continuous, via cloud-based inverter monitoring), annual visual inspection for damage or debris accumulation, cleaning as needed (rain handles most of this in most climates — Jia Mao BIPV’s self-cleaning surface coating reduces cleaning frequency by 30%), and inverter servicing at approximately 10–15 years.
Annual BIPV maintenance costs for a commercial system average $0.01–$0.02/W — roughly $1,000–$2,000/year for a 100 kW system. Inverter replacement at year 10–15 costs approximately $8,000–$15,000 for a commercial-scale string inverter system.
Traditional roofing maintenance for a commercial property averages $0.08–$0.15/sq ft annually — approximately $5,000–$8,500/year for a 5,000 sq ft roof, plus major repairs every 5–7 years.
The maintenance cost differential over 25 years is a meaningful component of BIPV’s total cost advantage.
Degradation Rates and Long-Term Output Projections
Modern crystalline BIPV modules degrade at approximately 0.5% per year based on NREL research — meaning a system producing 100 kW in year one produces approximately 88 kW in year 25 (88% of original capacity). This gradual output decline is predictable and is already factored into the ROI calculations in Section 5.
Premium manufacturers like Jia Mao BIPV warrant their monocrystalline modules at greater than 22% efficiency with built-in low-temperature coefficients to maintain stable output even in high-heat environments — a specification that directly protects the long-term revenue generation of your clients’ investments.
9. Market Conditions and Decision-Making Framework
When BIPV Makes Financial Sense
BIPV delivers its strongest economics when the following conditions converge:
The roof is due for replacement anyway — this is the single most important qualifier. When the roofing replacement cost is inevitable, the incremental cost of BIPV versus conventional roofing narrows dramatically, and the avoided material cost is most directly applicable.
The building has significant electricity consumption. High electricity users capture more annual savings per kW of BIPV installed. Commercial buildings consuming 200,000+ kWh/year are the sweet spot.
The project is located in a state or utility territory with favorable net metering and/or additional incentive programs on top of the federal ITC.
The property owner has a long time horizon — at minimum 10 years, ideally 15+. Short-hold investors rarely reach break-even on BIPV.
The project is in a climate zone with 3.5+ peak sun hours daily (which covers the vast majority of the continental US).
When Traditional Roofing Remains the Better Choice
Honesty in sales builds long-term client relationships. BIPV is not the right answer for every project:
Properties with hold periods under 5–7 years rarely justify BIPV premiums. Structures with significant shading from adjacent buildings or tree canopy face materially reduced energy production. Projects in jurisdictions with unfavorable net metering policies (utilities that pay wholesale rather than retail rates for exported energy) see longer paybacks. Budget-constrained projects where financing is unavailable or expensive should prioritize conventional roofing with a phased solar strategy.
Being the advisor who tells a client “not yet, here’s when it will make sense” builds more trust than overselling a marginal deal.
Hybrid Approaches: Combining Both Solutions
For large roofs where aesthetics or structural concerns limit full BIPV coverage, partial BIPV deployment is a legitimate strategy. BIPV panels on south-facing slopes combined with conventional roofing on north-facing slopes, for example, captures 80–90% of the solar production potential at significantly lower upfront cost. This phased approach also allows clients to stage capital investment, evaluate technology performance, and expand in later years when refinancing conditions improve.
10. Strategic Recommendations for Distributors and Sellers
Building Your BIPV Sales Competency
The distributors and contractors winning in BIPV are not the ones with the lowest prices. They’re the ones who show up to client meetings with a financial model instead of a product catalog.
The key talking points that resonate with commercial developers and contractors: “This roof generates $XX per year instead of costing $XX per year.” “The 30% federal tax credit means the government is funding almost one-third of your project.” “You’re going to replace this roof anyway — the question is whether your next roof earns money or just costs money.”
Address the common objections proactively: upfront cost (show the net cost after ITC and avoided materials), installation complexity (have a certified installer network ready), and technology uncertainty (lead with the 25-year manufacturer warranty and the 0.5% degradation rate data).
Developing BIPV Project Pipelines
The highest-ROI project pipeline for BIPV distributors in 2025 targets: commercial buildings in the 5,000–50,000 sq ft range with aging roofs (built before 2000), multi-family properties in high-electricity-rate states, industrial and logistics facilities with corporate ESG mandates, and mixed-use development projects where architectural integration adds premium value.
Build qualification criteria into your initial client conversations: What is the current electricity bill? When was the roof last replaced? Does the owner have sufficient tax liability to utilize the ITC? What is the planned hold period? These four questions will tell you whether a BIPV proposal is worth developing before you invest proposal development time.
Leveraging Incentives in Your Sales Strategy
Become the incentive expert in your territory. Subscribe to state energy office newsletters. Monitor DSIRE for program changes. Know your utility territories’ net metering rates and interconnection timelines. When you can tell a client in a first meeting exactly what incentive stack is available on their specific project, you separate yourself from every traditional roofing competitor immediately.
Create a simple one-page incentive summary for each major market you serve — federal ITC, state programs, utility incentives, property tax exemptions — updated quarterly. This becomes a powerful prospecting tool.
Competitive Positioning and Differentiation
Traditional roofing suppliers can match your materials and undercut your price. They cannot match your ability to deliver a building asset that generates revenue. The competitive frame is not “BIPV vs. traditional roofing.” It’s “a cost center vs. a revenue-generating asset.” Reframe the conversation and you change the competitive landscape entirely.
Value-added services that drive BIPV adoption: in-house ROI modeling capabilities, certified installer network management, financing partner introductions, incentive application support, and ongoing system monitoring services. Each of these creates client dependency and recurring revenue streams that a material-only distributor cannot replicate.
For product sourcing and custom specifications, Jia Mao BIPV’s product portfolio covers the full range — from transparent photovoltaic glass for facade applications to high-efficiency solar roof tiles — with custom sizing, color, and power output configurations available for project-specific requirements.
Recommended Video: Understanding BIPV Technology and Applications
For your team’s training library and for sharing with clients who want a visual introduction to how BIPV systems work and what they look like installed:
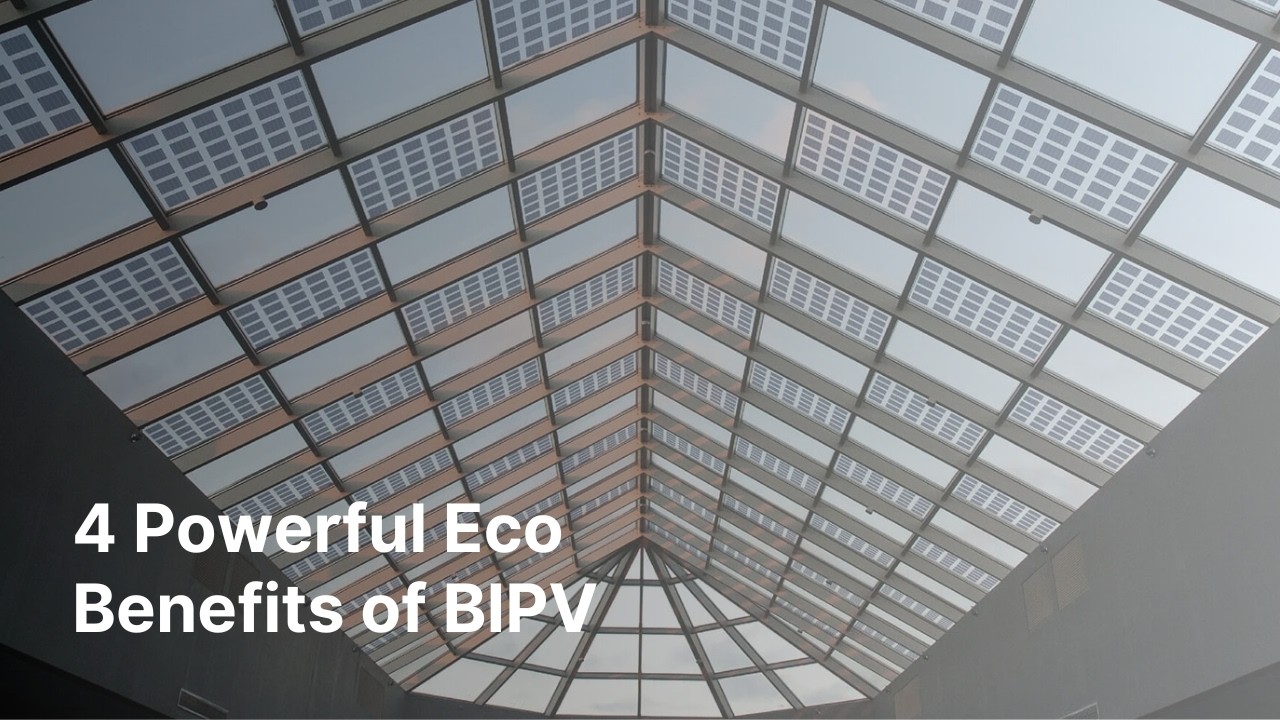
Watch: “BIPV Solar Explained — Future of Building Integrated Solar Energy” — a clear overview of how building-integrated photovoltaics differ from conventional solar and traditional roofing.
The Financial Case for BIPV in 2025
Summary of Key Cost-Benefit Findings
The data in this analysis leads to a clear conclusion: for the right project profile, BIPV is not an expensive green building feature — it’s a sound financial decision. The combination of declining BIPV manufacturing costs, the 30% federal ITC, MACRS depreciation, rising electricity rates, and growing property value premiums for energy-efficient buildings has crossed a threshold. For commercial renovation projects where roof replacement is already planned, BIPV’s net effective premium over conventional roofing is often far smaller than clients assume, and the 25-year TCO advantage is overwhelming.
The numbers don’t require advocacy. A traditional 5,000 sq ft commercial roof costs $80,000–$205,000 over 25 years with zero return. A BIPV system on the same roof — net of all incentives — returns $50,000–$500,000 over the same period. That is not a green building argument. That is a capital allocation argument.
How Market Dynamics Are Shifting in BIPV’s Favor
Three trends are converging simultaneously to accelerate BIPV adoption in your markets. First, electricity prices continue rising — every $0.01/kWh increase in commercial rates improves BIPV project economics across every project in your pipeline. Second, building energy codes are tightening in every major market, with net-zero energy building requirements becoming standard in commercial construction within this decade. Third, corporate sustainability commitments are translating into procurement requirements — institutional tenants are selecting buildings based partly on energy performance metrics. BIPV positions your clients ahead of every one of these trends.
Action Steps for Your Sales and Distribution Strategy
Start your BIPV capability build this month, not next quarter. Identify three commercial clients with aging roofs in high-electricity-rate locations in your territory. Request their last 12 months of utility bills and their last roof inspection report. Run a preliminary ROI analysis using the framework in this guide. Present the financial comparison — traditional roof TCO vs. BIPV TCO — in a 30-minute meeting. The conversation that follows will tell you exactly where your market opportunity is.
For long-term market leadership, invest in certified installer network development, financing partner relationships, and incentive expertise. These capabilities compound over time and create barriers to entry that protect your margins.
If you’re ready to move from interest to market action, Jia Mao BIPV offers product feasibility reviews, custom system specifications, and technical documentation support for distributors developing project proposals. Whether you’re evaluating a specific project or building a BIPV product line for your distribution business, the contact page is the fastest path to a technical conversation.
For broader BIPV installation guidance and design considerations, the BIPV installation and design guide on the Jia Mao BIPV website covers permitting, structural assessment, system sizing, and commissioning protocols.
For incentive research, the DSIRE clean energy incentive database and the NREL PVWatts calculator are your two most important free tools for proposal development.
 Comprehensive BIPV deployment across commercial roofing and facade — the direction institutional property owners are moving in 2025 and beyond. Source: Unsplash
Glossary of Key Terms
| Term | Definition | Example |
|---|---|---|
| BIPV | Building-Integrated Photovoltaics. Solar materials that replace, rather than supplement, conventional building materials. | A solar roof tile that replaces a clay tile while generating electricity. |
| BAPV | Building-Applied Photovoltaics. Rack-mounted solar panels installed on top of an existing, finished roof. | Standard solar panels on aluminum racking over an asphalt shingle roof. |
| ITC | Investment Tax Credit. A federal tax credit equal to 30% of eligible solar project costs, applicable to commercial and residential installations through 2034. | A $1M BIPV project earns a $300,000 tax credit. |
| MACRS | Modified Accelerated Cost Recovery System. IRS depreciation schedule allowing solar assets to be depreciated over 5 years rather than standard 27.5 or 39 years. | A $500,000 commercial BIPV system generates significant depreciation deductions in years 1–5. |
| C-PACE | Commercial Property Assessed Clean Energy. Off-balance-sheet financing for commercial energy improvements, repaid through property tax assessments. | A property owner finances $2M BIPV with no personal guarantee, repaid over 20 years through property taxes. |
| Net Metering | Utility policy allowing solar system owners to receive credit for electricity exported to the grid, typically at retail rates. | A building generating 150% of its electricity needs in July receives credits applied to winter months. |
| PPA | Power Purchase Agreement. A third-party investor owns the solar system; the property owner purchases electricity at a fixed rate below market. | A developer installs BIPV at zero upfront cost; property owner pays $0.10/kWh vs. $0.17/kWh utility rate. |
| TCO | Total Cost of Ownership. The complete financial cost of an asset over its useful life, including acquisition, maintenance, replacement, and opportunity costs. | 25-year TCO of BIPV vs. traditional roofing, inclusive of energy savings. |
| Peak Sun Hours | The equivalent hours per day when solar irradiance averages 1,000 W/m² — the standard reference condition. Not the same as daylight hours. | Phoenix averages 6.0 peak sun hours/day; Seattle averages 3.0–3.5. |
| Performance Ratio | The ratio of actual system energy output to theoretical maximum output, accounting for real-world losses. | A 0.80 performance ratio means the system captures 80% of theoretical maximum production. |
| VLT | Visible Light Transmission. The percentage of visible daylight that passes through a glazing product. | 30% VLT BIPV glass admits more daylight than 10% VLT glass but typically generates less power per m². |
| BOS | Balance of System. All system components other than the PV modules themselves — inverters, cabling, disconnects, monitoring, mounting hardware. | On a typical commercial BIPV project, BOS represents approximately 38% of installed cost. |
Frequently Asked Questions
FAQ 1: How much more expensive is BIPV compared to traditional roofing?
BIPV typically costs 40–60% more on a gross installed basis than premium traditional roofing. However, this headline comparison omits critical adjustments that change the real financial picture. When you account for the 30% federal ITC, the avoided cost of the conventional roofing material BIPV replaces, and MACRS accelerated depreciation for commercial installations, the net effective premium of BIPV over traditional roofing often falls to 15–30%. For commercial renovation projects where roof replacement is already budgeted, the incremental cost of BIPV is frequently less than $10–15/sq ft net of all incentives — a premium that can be recovered in 8–12 years of energy savings.
FAQ 2: What is the realistic ROI timeline for a BIPV renovation project?
Most well-structured commercial BIPV projects achieve positive cumulative ROI between years 8–12 when all incentives are properly applied. High-electricity-rate states (California at $0.20+/kWh, Massachusetts at $0.18+/kWh) combined with strong state-level incentive programs can compress this to 6–8 years. Residential multi-family properties typically reach break-even in 10–15 years. After break-even, the energy savings compound for the remaining system life — typically 15–17 additional years of pure financial return.
FAQ 3: How do federal tax credits affect the BIPV vs. traditional roofing decision?
The 30% ITC is a game-changer in commercial project economics. Traditional roofing receives no comparable federal tax benefit — it is treated as a routine building maintenance expense with standard depreciation. BIPV qualifies for both the ITC (30% of gross cost as a direct tax credit) and MACRS 5-year accelerated depreciation on the solar component. Together, these tax benefits can offset 40–50% of gross project cost in the early years. For commercial property owners with sufficient tax appetite, this fundamentally changes the net cost comparison before a single watt of electricity is ever generated.
FAQ 4: Are BIPV systems more durable than traditional roofing?
BIPV systems built to architectural standards — using laminated safety glass, B1-grade flame-retardant encapsulants, and structural adhesive systems warranted for 25+ years — are as durable as or more durable than premium conventional roofing. Jia Mao BIPV’s monocrystalline glass modules, for example, meet curtain wall wind pressure resistance standards of 4.0 kPa, with UV aging resistance enhanced 40% by imported POE encapsulant films. The key difference is that BIPV systems include electrical components that require monitoring — while traditional roofing is purely mechanical. Both have maintenance requirements; BIPV’s maintenance cost is typically lower per year than commercial roofing.
FAQ 5: What happens to BIPV systems during cloudy weather or winter?
BIPV systems produce electricity in any daylight condition, though output varies with irradiance. On overcast days, systems typically produce 15–25% of peak rated capacity — sufficient to offset base electrical loads in most commercial applications. Winter months in northern climates produce 30–40% less energy than summer peak months. Annual production models account for these seasonal patterns using full-year hourly irradiance data from sources like NREL’s National Solar Radiation Database. Conservative proposals use full-year production averages, never peak-summer figures, to ensure client expectations are based on realistic annual performance.
FAQ 6: Can BIPV be installed on existing roofs, or does the roof need replacement?
BIPV delivers its best economics when integrated during planned roof replacement or new construction — because the incremental cost calculation works most favorably when the conventional roofing cost is being spent regardless. BIPV can be retrofitted onto existing roofs if the structural system can support the additional load, electrical infrastructure is adequate, and the remaining useful life of the existing roof justifies the investment. As a rule of thumb, retrofitting BIPV onto a roof with more than 10 years of remaining life is rarely cost-effective unless electricity rates are very high or incentives are exceptional.
FAQ 7: How do property taxes and insurance costs change with BIPV installation?
Property tax treatment of BIPV varies significantly by state. Approximately 36 states have adopted full or partial property tax exemptions for solar energy systems — meaning BIPV’s assessed value contribution is excluded from property tax calculations. In states without exemptions, increased assessed value from BIPV can add $500–$3,000 annually to property taxes on a commercial installation. Insurance costs typically remain stable or decrease modestly — BIPV systems that improve roof weather resistance (higher wind uplift ratings, better waterproofing) can qualify for improved insurance terms with some carriers. Always verify state-specific tax treatment in your market using the DSIRE database.
FAQ 8: What financing options are available specifically for BIPV projects?
The financing toolkit for commercial BIPV is genuinely diverse in 2025. Options include C-PACE financing (no balance sheet impact, 10–30 year terms, available in 37+ states via the C-PACE Alliance), solar-specific equipment loans through banks and specialty lenders, PPA structures where a third-party investor owns the system and sells power at fixed rates, Energy Savings Agreements tied to measured savings, and direct bank financing at 6.5–9.0% for creditworthy commercial borrowers. For distributors, having established referral relationships with 2–3 financing providers significantly increases proposal conversion rates.
FAQ 9: How does the BIPV market differ between residential and commercial applications?
Commercial BIPV projects consistently achieve faster payback due to four structural advantages: higher absolute electricity consumption (more savings per kW installed), larger system sizes enabling economies of scale in installation, better access to commercial financing structures (C-PACE, equipment finance, tax equity), and the ability to fully monetize MACRS accelerated depreciation. Residential BIPV benefits more from personal ITC, home value appreciation premiums, and lower visible aesthetic thresholds — but faces higher per-watt installed costs and longer payback periods. For distributors building a BIPV business, commercial projects in the 50–500 kW range offer the best combination of margin, deal size, and replicable financial models.
FAQ 10: What training or certification do installers need for BIPV systems?
BIPV installation requires a licensed electrical contractor at minimum, plus product-specific training from the BIPV manufacturer. Most reputable manufacturers offer certified installer programs covering product-specific installation sequencing, electrical integration, waterproofing protocols, and warranty requirements. Some states require additional specialty licensing for solar installations. For distributors, building a network of manufacturer-certified installers in your territory is a meaningful competitive differentiator — and a prerequisite for offering customers any meaningful installation warranty coverage. Contact Jia Mao BIPV for information on their installer training and certification programs.
FAQ 11: How do changing electricity rates affect BIPV ROI calculations?
BIPV economics improve proportionally with electricity rates — making rate escalation assumptions one of the most important variables in project financial modeling. Historical US commercial electricity rate increases have averaged 2.0–3.0% annually over the past decade. Conservative proposals assume 2.5% annual escalation; aggressive proposals may assume 3.0–3.5% in markets with strong rate escalation history. Even a 1.0% difference in escalation assumption changes 25-year cumulative savings by 10–15% on a typical commercial project. Always sensitivity-test your ROI models at 1.5%, 2.5%, and 3.5% escalation rates to give clients a realistic range.
FAQ 12: Can BIPV systems be easily upgraded or expanded in the future?
Modern BIPV systems are designed with future expansion in mind — electrical infrastructure (inverter capacity, main service panel size, interconnection agreement) is the primary constraint. Planning for expansion capacity during initial installation — oversizing the inverter, conduit, and interconnection by 20–30% — adds minimal cost and significantly reduces future expansion costs. BIPV modules themselves can be added to expand system size when roof space permits. Planning for future expansion is a service differentiator: clients who anticipate business growth or additional property acquisitions appreciate a BIPV partner who thinks 10 years ahead.
FAQ 13: What is the difference between BIPV and traditional rooftop solar panels?
Traditional rooftop solar (BAPV) installs rack-mounted panels on top of a completed, finished roof — two separate systems serving two separate functions. BIPV replaces the conventional building material itself with a photovoltaic material that simultaneously serves as the weather barrier and the power generator. BIPV eliminates the redundancy cost of “solar on top of a roof,” integrates more seamlessly with building aesthetics, and allows for innovative applications like transparent facade glass and solar tiles that would be impossible with conventional rack-mounted panels. The trade-off is higher initial complexity and cost — offset by the dual-function value and avoided conventional material cost. For a detailed technical comparison, Solar Roof Tiles vs Traditional Panels provides additional specification data.
FAQ 14: How do I calculate the annual energy production for a specific BIPV project?
Use the production formula: Site-specific peak sun hour data is available from the NREL PVWatts Calculator — the industry standard tool for US-based production estimation. For BIPV facades and non-horizontal installations, enter the actual tilt and azimuth angles to get accurate production estimates. Always present production estimates using full-year averages with a clearly stated performance ratio. For client-facing proposals, consider commissioning a third-party production model using PVsyst software — the added credibility of a third-party validation justifies the $500–$1,500 cost on projects above $200,000.
FAQ 15: What should be included in a comprehensive BIPV vs. traditional roofing financial comparison?
A complete 25-30 year financial comparison must include: gross installed costs for both options, the avoided conventional roofing material cost (netting against BIPV gross cost), all applicable federal and state incentives and their application timelines, annual energy production and savings at conservative electricity rate escalation, MACRS depreciation benefits for commercial projects, maintenance and replacement cost schedules for both options (including inverter replacement at year 10–15 for BIPV), property tax and insurance implications, and a sensitivity analysis showing outcomes at low/base/high electricity rate escalation scenarios. For multi-family and commercial income-producing properties, include the capitalized value of NOI improvements from reduced operating expenses. A 25-30 year analysis period is the minimum required to capture the full lifecycle value of BIPV — shorter comparisons systematically understate BIPV’s financial advantage.
For additional BIPV technical resources, cost guidance, and project feasibility support, visit www.jmbipvtech.com. For the authoritative IEA technical reference on BIPV system design, see the IEA PVPS Building-Integrated Photovoltaics Technical Guidebook. For US solar incentive research, the DSIRE database and SEIA are the definitive resources.