Understanding how wholesale distributors and manufacturer representatives control market access, inventory bottlenecks, and pricing power in the rapidly growing solar sector—and how to leverage this advantage for competitive success.
 Solar distribution infrastructure: where manufacturing output meets market demand. Photo: Unsplash
The Distributor’s Critical Role in Solar’s Growth
The global solar photovoltaic (PV) industry added a record 510 GW of new capacity in 2025 alone, bringing cumulative global installed capacity to approximately 2,383 GW — a number that would have seemed fantastical even a decade ago. Behind every one of those gigawatts is a project: a commercial rooftop, a utility farm, a building facade. And behind every one of those projects is a supply chain that either enabled it or slowed it down.
Most industry conversations celebrate manufacturers and installers. Very few center on the actors who quietly hold the entire ecosystem together: wholesale distributors and manufacturer representatives. These are the companies and individuals who bridge the gap between a factory floor in Guangdong or Shanghai and a construction site in Madrid, Texas, or Melbourne. They are the hidden gatekeepers — and in a market defined by allocation scarcity, tariff volatility, and explosive demand, their leverage has never been greater.
Why Distributors Hold the Keys to Market Power
Distributor control in solar rests on three foundational pillars that compound in value as the market grows:
- Territorial exclusivity — Locking competitors out of defined geographies through manufacturer-sanctioned agreements that can take years to renegotiate.
- Inventory leverage — The ability to stockpile during constrained periods, then release supply strategically, effectively setting local availability timelines for entire regions.
- Relationship capital — Long-tenured partnerships with manufacturer account managers who prioritize loyal distribution partners during allocation squeezes over spot buyers.
As market consolidation continues — driven by M&A activity across the renewable energy sector — these three pillars are increasingly concentrated in fewer hands. For distributors who build them deliberately, the competitive moat is becoming extraordinarily deep. For those who don’t, the risk of disintermediation grows every quarter.
What This Guide Covers
This article is written for solar distributors, resellers, agents, and construction firms operating in the B2B segment of the PV supply chain — not end consumers. Whether you’re navigating a manufacturer allocation squeeze, preparing for a pricing negotiation, or evaluating whether to expand your product portfolio to include BIPV (Building-Integrated Photovoltaics), this guide delivers specific, data-grounded strategies.
By the end, you will have a clear picture of how the solar supply chain actually functions beneath its surface, where the true leverage points are, and what actions to take in the next 90 days to strengthen your market position.
The Current State of the Solar Supply Chain
Market Growth and Its Impact on Distribution Networks
The solar industry’s growth trajectory is not a gradual curve — it is a near-vertical climb that is straining every link in the distribution chain simultaneously. According to IEA-PVPS’s Trends in Photovoltaic Applications 2025, the world surpassed 2,260 GW of cumulative installed PV capacity mid-year 2025, and Solar Power Europe projects global annual installations reaching 930 GW by 2029.
This isn’t just impressive — it’s operationally disruptive. When a market doubles its annual installation rate within a five-year window, logistics networks, warehousing infrastructure, and credit lines are all stretched to their limits. Distributors who sized their operations for a 200 GW/year market are suddenly operating in a 500+ GW/year environment with the same headcount, the same warehouse square footage, and the same supplier agreements they negotiated three years ago.
The regional picture is equally uneven. In North America, the SEIA reported that the US solar industry installed 11.7 GW in Q3 2025 alone — a 20% increase from Q3 2024, though Q2 2025 saw a 24% decline, illustrating the extreme volatility that makes demand forecasting so difficult. In Europe and Asia-Pacific, growth is more consistent but equally capital-intensive to service.
Industry Insight: The volatility between quarters — a 24% decline followed by a 20% surge — is not a market anomaly. It is the new normal. Distributors who build their operations around a steady baseline will be permanently caught off-guard. Those who build for volatility management will consistently outperform.
The Shift From Manufacturer-Direct to Distributor-Dependent Models
In the early years of the solar market, many tier-1 manufacturers maintained strong direct-sales arms. They had regional offices, in-country account teams, and direct contracts with large EPCs and utilities. That model worked when volumes were smaller and projects were fewer.
Today, the sheer volume of transactions — hundreds of thousands of installation projects annually across dozens of markets — makes full manufacturer-direct coverage economically unsustainable for all but the largest national accounts. Manufacturers have recognized that a trusted regional distributor with boots on the ground, local credit relationships, and language-compatible technical support delivers a lower cost of customer acquisition and a higher retention rate than any centralized direct sales team can.
This structural shift is not reversible. Manufacturers need distributors not just for logistics, but for market intelligence, local regulatory navigation, and the kind of relationship maintenance that drives repeat orders. The channel is no longer a convenience — it is the model.
Key Players and Their Influence
The distribution landscape has bifurcated into two distinct tiers. At the top are large-scale national or multi-regional distributors — firms that carry multi-gigawatt annual volumes, negotiate at the corporate level with Tier-1 manufacturers, and increasingly function as quasi-financial intermediaries by extending credit to their downstream customer base. Below them, a vibrant ecosystem of regional specialists competes on depth of local knowledge, speed of delivery, and category expertise.
It is the second tier — the regional specialists — where most of the competitive action occurs, and where the strategies in this guide are most directly applicable. Companies like those partnering with Jia Mao BIPV increasingly find that product specialization (BIPV, bifacial modules, transparent solar glass) creates defensible positioning that commodity distributors cannot easily replicate.
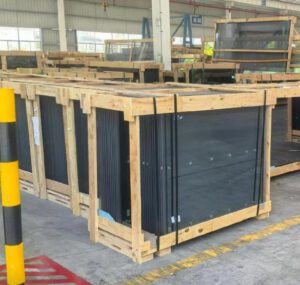
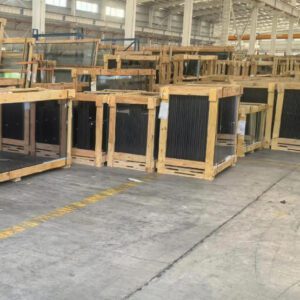
 Strategic warehousing is a core competitive weapon for solar distributors.
How Distributors Control Market Access
Exclusive Territory Agreements and Their Strategic Value
In solar distribution, territory is everything. An exclusive territory agreement (ETA) gives a distributor the contractual right to be the sole authorized channel for a specific manufacturer’s products within a defined geographic boundary — a state, a country, or a multi-country region. This is not merely a commercial convenience; it is a fundamental market barrier.
When a distributor holds the exclusive right to sell a high-efficiency manufacturer’s product line in a given territory, every installer, EPC, and developer in that region must either buy from them or forgo the product entirely. The downstream customer’s negotiating position collapses. Pricing power flows entirely upstream to the exclusive holder.
Securing these agreements requires deliberate relationship investment. Manufacturers grant exclusivity to distributors who can demonstrate three things: market coverage depth (the ability to reach customers across the territory), financial stability (the ability to commit to meaningful minimum purchase volumes), and brand alignment (a proven track record of representing the manufacturer’s products professionally). Building a credible case on all three dimensions before entering negotiations is essential.
The mechanics of negotiating favorable terms include framing the agreement around mutual growth milestones rather than pure volume minimums, securing performance-based renewal clauses that reward demonstrated market share growth, and explicitly defining the territory boundaries to prevent gray-market channel conflict.
Inventory Management as a Gatekeeping Tool
Inventory is power in a constrained market. During the supply shortfalls of 2021–2023 — when shipping container costs spiked 700%, polysilicon prices tripled, and delivery lead times stretched to 40+ weeks — distributors who had pre-positioned stock became the de facto arbiters of which projects moved forward and which stalled.
Strategic stockpiling requires capital, warehouse infrastructure, and the ability to accurately forecast demand 90–180 days ahead. It also requires strong relationships with your banking or trade finance partners, since holding $10M–$50M of slow-moving inventory generates carrying costs that can erode margins rapidly if market conditions shift.
The discipline lies in tiered stockpiling: maintaining deep positions in high-certainty, fast-moving SKUs while keeping lighter buffer stock in emerging categories. A common industry benchmark is safety stock at 15–25% of monthly sales volume for core lines — enough to bridge a four-to-six-week supply disruption without tying up excessive capital.
Relationship Capital: Building Partnerships With Manufacturers
The most durable competitive advantage a distributor can build is one that doesn’t show up on any balance sheet: the depth of trust with key manufacturer account managers and regional directors. When allocations are tight, manufacturers don’t run optimization algorithms — they make phone calls to the distributors they trust.
This trust is built through consistent behavior over years: accurate demand forecasts that prove reliable (rather than inflated forecasts designed to game the allocation process), payment on schedule without exception, honest communication about market conditions (including bad news), and visible investment in promoting the manufacturer’s brand in the market.
Distributors who participate in manufacturer planning sessions, co-invest in marketing, and bring meaningful market intelligence to the relationship — such as real-time installer sentiment, project pipeline data, and competitive landscape updates — consistently receive preferential allocation treatment versus those who operate purely transactionally.
The Inventory Bottleneck Crisis and Solutions
Understanding Current Supply Chain Disruptions
The solar supply chain of 2025 faces a paradox: manufacturing capacity has never been greater, yet project-level availability crises remain commonplace. China’s manufacturing expansion has created global polysilicon capacity exceeding 460 GW equivalent annually, yet localized shortages persist because the geographic mismatch between where modules are made and where projects need them is vast and expensive to bridge.
The disruption layers are structural rather than temporary. Tariff volatility — particularly the aggressive trade policy shifts implemented in the United States beginning in 2025 — has fundamentally altered the cost and routing calculus of global module supply. FTI Consulting noted that these tariffs have caused “major market disruption and uncertainty across global supply chains,” forcing distributors to rapidly reroute procurement from Southeast Asian manufacturers to alternative geographies or absorb significant cost increases.
Simultaneously, freight and logistics costs, while off their 2022 peaks, remain elevated relative to pre-2020 baselines. The practical consequence for distributors: procurement decisions made today must account for 12–16 week delivery windows, currency fluctuation risk, and the possibility of regulatory changes mid-shipment.
How Distributors Allocate Limited Inventory
When supply is constrained, the criteria by which distributors allocate inventory to their downstream customers reveal their strategic priorities — and shape their long-term customer relationships. The most effective allocation frameworks balance fairness with strategic purpose.
The following table illustrates how leading distributors prioritize allocation during shortage periods:
| Allocation Priority Tier | Customer Criteria | Typical % of Available Inventory |
|---|---|---|
| Tier 1 — Strategic Accounts | Long-term contracts, volume commitments, 24+ month relationship | 40–50% |
| Tier 2 — Growth Partners | Demonstrating YoY volume growth, active project pipeline | 25–30% |
| Tier 3 — Standard Accounts | Consistent but non-committed buyers | 15–20% |
| Tier 4 — Spot/New Customers | No established relationship or commitment | 5–10% |
This framework is not punitive — it is self-reinforcing. Customers who receive reliable supply during shortages become more loyal, more likely to commit volume in writing, and more likely to co-invest in the relationship. Spot buyers who are deprioritized during constraints learn quickly that the path to reliable supply runs through formal partnership structures.
Building Resilience Through Diversified Supplier Relationships
No single-source strategy survives a prolonged supply disruption. Distributors who concentrate 80%+ of their volume with one manufacturer face an existential risk every time that manufacturer faces a factory incident, a regulatory action, or a strategic pivot.
The resilience framework requires maintaining active relationships with a minimum of three to five manufacturers per core product category, with documented second-source agreements that specify minimum lead times and pricing commitments. This doesn’t mean spreading volume so thinly that no single manufacturer views you as a priority — it means building a portfolio of relationships at different volume tiers, where your primary partner receives 60–70% of your business and secondary partners are kept warm with regular orders and active communication.
For distributors expanding into BIPV and specialized solar building materials, working with dedicated manufacturers like Jia Mao BIPV provides an additional diversification layer — BIPV products serve a different project type than commodity modules, and the customer base (architects, developers, glazing contractors) rarely overlaps, making supply diversification and market diversification coincide.

Pricing Power: Who Sets the Market Rate
The Pricing Hierarchy in Solar Distribution
The solar pricing hierarchy is less a clean pyramid and more a dynamic negotiation web. Manufacturer Suggested Retail Price (MSRP) is the official benchmark, but virtually no distributor pays it and virtually no installer charges it. The real pricing structure is determined by volume, relationship tenure, payment terms, and — increasingly — exclusivity arrangements.
Module prices have continued their long-term decline: the US DOE reported average module prices of approximately $0.31/Wdc in Q2 2024, down 16% year-over-year. This deflationary pressure on the module commodity side is squeezing distributor margins on standard products, making the ability to sell differentiated, higher-margin products (BIPV, energy storage, inverters, BOS components) increasingly critical to maintaining overall business health.
Volume tiering structures typically follow this pattern across the industry:
| Monthly Volume Tier | Typical Discount Off List | Payment Terms Available |
|---|---|---|
| < 500 kW | 0–5% | Net 30 |
| 500 kW – 2 MW | 5–12% | Net 45–60 |
| 2 MW – 10 MW | 12–18% | Net 60–90 |
| > 10 MW | 18–25%+ | Custom / LC |
These tiers are not fixed — they are negotiation starting points. Distributors who can demonstrate geographic exclusivity, multi-year volume commitments, and strong end-customer reach regularly achieve pricing outside these standard bands.
How Distributors Influence End-Market Pricing
The distributor’s margin sits between manufacturer net price and the price charged to installers, EPCs, and developers. Industry benchmarks place wholesale distributor margins at 8–15% on standard commodity modules and 15–25% for reseller/agent arrangements on specialty or BIPV products. These figures have come under downward pressure as larger distributors use volume pricing to undercut regional players.
The mechanism by which distributors influence end-market pricing is subtler than it first appears. By choosing when to release inventory, how aggressively to pursue new installer accounts, and what minimum order quantities to enforce, a well-positioned regional distributor can effectively set the floor price for their market. When module availability is tight, this floor rises. When it is abundant, the distributor’s ability to hold pricing depends entirely on service differentiation and relationship stickiness.
Negotiating Better Pricing for Your Business
The single most powerful lever in manufacturer price negotiations is documented commitment — not historical volume, but forward commitment with specificity. A distributor who walks into a negotiation with a 12-month rolling purchase schedule, a geographic market analysis showing their competitive position, and a co-marketing proposal consistently outperforms one who simply references past order history.
Concrete negotiation leverage points include: volume commitment letters for the next 6–12 months with realistic milestones, exclusive territory proposals that expand the manufacturer’s effective reach at no direct cost to them, co-investment in local marketing and installer training that demonstrably builds the manufacturer’s brand equity, and payment acceleration offers (paying in 15 days rather than 60 days) in exchange for additional price concessions.
Strategic Advantages for Distributors and Resellers
Consolidation Benefits: Economies of Scale
Scale advantages in solar distribution are not linear — they compound. A distributor moving from 5 MW/month to 50 MW/month doesn’t achieve a 10x cost reduction, but they may achieve a 2–3x margin improvement through the combined effect of volume pricing, lower per-unit logistics costs, shared overhead amortization, and enhanced access to capital markets.
Bulk purchasing power manifests most concretely in module pricing (as shown in the tier table above), but extends to freight consolidation (full container loads vs. LCL shipments reduce per-panel logistics cost by 15–30%), warehousing efficiency (higher throughput per square foot), and credit terms (larger players access 90–120 day payment terms that smaller distributors cannot).
Operational efficiency gains include the ability to invest in dedicated inventory management software — platforms that track stock levels in real time, trigger automated reorder points, and integrate with customer-facing ordering portals. These systems, once viewed as enterprise-only tools, are now accessible at mid-market scale and deliver measurable ROI through reduced stockout events and lower carrying costs.
Data and Market Intelligence as Competitive Weapons
A regional distributor with active relationships across 200+ installer accounts possesses market intelligence that no manufacturer’s central sales team can replicate. The demand signals flowing through daily order patterns, installer questions, project pipeline discussions, and payment timing reveal the true state of the local market weeks or months before that data appears in any industry report.
This intelligence has tangible monetizable value. Distributors who systematize their data capture — tracking order frequency, product mix shifts, project type distribution, geographic clustering of activity — can build demand forecasts accurate enough to justify more aggressive inventory positioning, which in turn enables better manufacturer commitments and pricing. The cycle is self-reinforcing: better data drives better forecasting, which drives better inventory decisions, which drives better margins, which funds better data systems.
Technology and Digital Integration
The acceleration of digital transformation in distribution is reshaping customer expectations and operational benchmarks simultaneously. Installer customers who manage 20–50 projects simultaneously have no patience for phone-based ordering systems, PDF price sheets, or manual availability confirmations. They expect real-time inventory visibility, online order placement with automatic confirmation, and integrated project documentation support.
Distributors who have deployed B2B e-commerce platforms report measurable improvements in order frequency (customers who can self-serve order more often), average order size (digital upsell and bundling logic works), and customer satisfaction scores. The automation of routine transaction processing — order confirmation, invoice generation, shipping notification — also frees up sales teams to focus on relationship development and new account acquisition.
🎬 Watch: Solar Supply Chain Disruptions — What Distributors Need to Know

An in-depth industry analysis of current PV supply chain challenges, distributor strategies, and how wholesale channels are adapting to a volatile global market. Watch on YouTube →
Overcoming Common Distribution Challenges
Managing Demand Volatility
The quarterly volatility data from SEIA — a 24% decline in Q2 2025 followed by a 20% surge in Q3 — makes the point starkly: solar demand does not move in straight lines. Policy changes (tariff announcements, incentive program modifications, grid interconnection queue rule changes) can shift project pipeline timing by two to three quarters in either direction, creating feast-or-famine inventory cycles that test any distribution operation.
Effective volatility management begins with separating structural demand (the secular growth trend) from cyclical noise (policy-driven timing shifts). The former should inform multi-year capacity planning; the latter should inform safety stock levels and pricing tactics. Distributors who confuse the two — either ignoring cyclical risk because long-term trends are positive, or scaling back strategic investment because of a single bad quarter — consistently underperform those who manage both horizons simultaneously.
Demand forecasting tools have advanced significantly. AI-driven platforms now incorporate satellite imagery of project sites, permitting database feeds, utility interconnection queue data, and macroeconomic indicators to generate regional demand forecasts with 70–80% accuracy at the quarterly horizon. At the price points these tools now operate (many under $1,000/month for mid-market versions), the ROI from even modest inventory optimization easily justifies the investment.
Competing Against Larger Distributors
The most dangerous response to competition from larger, better-capitalized distributors is to attempt to compete on their terms — which means competing on price. That race ends at margins that no mid-sized distributor can sustain. The winning response is deliberate niche positioning.
Niche positioning in solar distribution can take several forms: product category depth (being the go-to source for BIPV, agrivoltaics, or floating solar components in a region), customer segment expertise (serving commercial-industrial developers with complex technical requirements rather than residential installers), or geographic micro-focus (owning a specific metropolitan market so completely that no competitor can match your response time and local knowledge).
The specialized technical service capability deserves particular emphasis. When a developer is designing a 5,000-square-meter BIPV curtain wall for a Class-A office tower, they need a distributor who can discuss PV glass transmittance values, wind load specifications, and architectural approval processes — not just price per watt. This expertise creates switching costs that pure-price competitors cannot overcome.
Navigating Manufacturer Relationship Complexities
Managing multiple manufacturer relationships simultaneously creates inherent tensions. Volume commitments to Manufacturer A may conflict with trial orders for Manufacturer B. Exclusivity with Manufacturer C may create awkward conversations with Manufacturer D, whose products overlap in certain categories. These tensions require deliberate relationship architecture rather than ad-hoc management.
Best practice involves categorizing manufacturer relationships explicitly: primary partners (top 2–3 manufacturers receiving 60–70% of total volume), development partners (2–4 manufacturers being grown toward primary status), and exploratory relationships (1–3 manufacturers being evaluated). Each category receives a different level of investment in communication, co-marketing, and volume commitment, allowing the distributor to manage competing priorities with transparency and structure.
 The BIPV segment — a specialty where technical expertise creates durable competitive advantage over commodity distributors. Photo: Unsplash
Future Outlook: Evolution of Solar Distribution
Emerging Trends Reshaping the Landscape
The most structurally significant trend facing traditional solar distributors is the gradual emergence of manufacturer-direct digital platforms. Several Tier-1 manufacturers have invested in e-commerce portals that allow large installers to order directly, bypassing traditional distribution channels for commodity transactions. This is not yet an existential threat — the logistics, credit, and local support infrastructure that distributors provide remains difficult to replicate centrally — but it is a clear signal of directional intent.
New technologies are also disrupting traditional supply chain configurations. The rapid growth of BIPV (Building-Integrated Photovoltaics) — a market valued at USD 31.1 billion in 2025 and projected to grow at 15.80% CAGR through 2034 (IMARC Group) — represents both a threat and an opportunity. It is a threat because BIPV routes products through architectural and construction channels that differ from standard solar distribution pathways. It is an opportunity because distributors who develop BIPV competency early can secure first-mover advantage in a high-value category before larger commodity distributors recognize its potential.
The Solar AI market — tools for demand forecasting, project assessment, and supply chain optimization — is growing at a 20.8% CAGR, reaching a projected $8.6 billion in 2026 (Grand View Research). Distributors who delay AI adoption are not just missing an efficiency opportunity; they are ceding a data intelligence advantage to better-equipped competitors.
Preparing Your Distribution Business for Change
Adaptability is not a mindset — it is an operational capability that must be built deliberately. Distributors preparing for the next five years of market evolution need to invest in three areas concurrently: technology infrastructure (inventory, forecasting, CRM, e-commerce), product portfolio depth (moving beyond commodity modules into inverters, storage, BIPV, and balance-of-system components), and human capital (technical sales staff who can support complex project types rather than just process transactions).
The capital allocation question is real: these investments compete with each other for limited budget. The prioritization framework should be guided by ROI timeline and competitive urgency. Technology investments in inventory management typically pay back within 12 months through reduced stockout losses and lower carrying costs. Product portfolio expansion requires longer lead times (12–24 months to build genuine category expertise) but delivers structural margin improvement that compounds over time.
Consolidation and Market Consolidation Predictions
M&A activity in the renewable energy distribution sector accelerated through 2024–2025, driven by private equity interest in the sector’s growth fundamentals and the strategic logic of scale in a margin-compressed market. PwC’s 2025 M&A outlook for energy identified distribution infrastructure as a priority acquisition target, and FTI Consulting reported that despite market uncertainty, credit-deadline-driven M&A deals revived deal flow in the second half of 2025.
For independent distributors, consolidation presents both threat and opportunity. The threat is the obvious one: a competitor backed by PE capital can sustain price wars longer, negotiate better manufacturer terms, and invest in technology at a pace that independent operators cannot match. The opportunity is less visible but equally real: consolidating buyers need regional distribution assets with established customer relationships and manufacturer agreements. Well-positioned regional distributors have strategic value that is not visible in their financial statements — and proactive engagement with potential acquirers or merger partners, before being forced to negotiate from weakness, is a legitimate strategic option.
Maximizing Your Competitive Position as a Distributor
Building Stronger Manufacturer Partnerships
The distributors who consistently receive priority allocation, best pricing, and first access to new product launches share one observable characteristic: their manufacturer partners know exactly what they’re getting in the relationship, and they consistently receive it. Transparency and predictability are not soft virtues — they are commercially valuable behaviors that manufacturer account managers reward.
Practically, this means establishing quarterly business reviews with each primary manufacturer partner — structured meetings where you present your actual sales performance against commitments, share market intelligence from your installer network, discuss upcoming project pipeline and the inventory implications, and propose collaborative initiatives (co-funded marketing, installer training, new territory development) that align your interests. Manufacturers who receive this level of structured engagement allocate to you because you are easier to plan around than the distributor who only calls when they need something.
Win-win collaboration models extend beyond the transactional. The most advanced distributor-manufacturer relationships include joint demand planning with 12-month rolling forecasts, shared sales data that helps the manufacturer refine their production planning, and co-investment in market development activities (installer certification programs, architectural specification workshops, developer roadshows) that expand the total addressable market rather than just competing for existing wallet share.
Enhancing Customer Value Beyond Price
The distributors who will thrive in the next decade of solar growth are not the ones with the lowest price — they are the ones whose customers genuinely cannot afford to replace them. This irreplaceability is built through service depth that goes beyond product delivery.
Technical pre-sales support is one of the most underinvested differentiators in solar distribution. When an installer is designing a 500kW commercial rooftop system and has questions about module compatibility with a specific inverter platform, string length optimization, or roof loading calculations, the distributor who can answer those questions in real time — rather than referring them to a manufacturer hotline — earns a loyalty premium that persists long after the project closes.
Post-installation support is equally powerful. Jia Mao BIPV’s distributor partner program is explicitly designed to support this post-sale technical engagement layer — providing distribution partners with the product knowledge, documentation tools, and direct manufacturer support access needed to serve BIPV installation projects end-to-end. For BIPV distributors serving architects and contractors unfamiliar with PV performance specifications, this kind of back-end support is not a nice-to-have — it is a prerequisite for credibly participating in the market.
Investing in Your Distribution Infrastructure
Infrastructure investments in solar distribution fall into three broad categories: digital systems, physical logistics, and human talent. All three matter; under-investing in any one creates operational bottlenecks that cancel out gains in the others.
On the digital side, the investment priorities are inventory management systems with real-time visibility and automated replenishment logic, CRM platforms that track relationship quality metrics (not just transaction history) across every installer and developer account, and e-commerce capabilities that allow 24/7 self-service ordering for routine transactions. These systems typically require 6–12 months to fully implement and another 6 months to optimize — meaning the time to start is now, not when competitive pressure is already intense.
Talent development deserves equal weight. The technical complexity of modern solar systems — bifacial modules, battery storage integration, BIPV architectural applications — means that sales teams who cannot discuss these products in detail are increasingly marginalized. Investing in structured training programs, industry certifications, and specialized hiring for technical sales roles is not a cost center; it is the foundation of the service differentiation that justifies margin premium.

Leveraging Your Gatekeeper Status Responsibly
The Sustainable Path Forward for Distributors
The gatekeeper status that solar distributors occupy is not guaranteed — it is earned and re-earned through the value delivered to both ends of the supply chain simultaneously. Manufacturers grant distribution rights to partners who reliably expand their market reach and protect their brand. Installers and developers remain loyal to distributors who provide reliable supply, honest pricing, and technical support that makes their projects easier to execute.
Distributors who use their market position extractively — inflating prices during shortage periods to capture windfall margins, cherry-picking customers during allocation crunches in ways that damage long-term relationships, or providing inaccurate forecasts to manipulate manufacturer allocations — may win short-term gains at the cost of the trust infrastructure that makes their position durable.
The solar industry’s growth trajectory is exceptional enough to generate substantial returns for distributors who manage their position thoughtfully. A market growing from 500 GW annual additions today toward 930 GW by 2029 creates enormous headroom for well-positioned regional players. The question is not whether the opportunity exists — it demonstrably does — but whether your distribution business is structured to capture it sustainably over a multi-year horizon.
Key Takeaways for Distribution Success
The core principles distilled from this guide are actionable and sequenced: build territorial exclusivity before your competitors do, invest in inventory intelligence before the next shortage cycle, deepen manufacturer relationships continuously rather than transactionally, differentiate through technical service rather than price, and expand into high-margin specialty categories (BIPV, storage, agrivoltaics) while the commodity market still subsidizes the investment.
The implementation timeline for these priorities maps to your current position. If you are primarily a commodity module distributor with no exclusive agreements and no specialty category presence, the 90-day priorities are: initiate one exclusive territory negotiation, deploy a basic inventory forecasting tool, and identify one specialty category to develop. If you are a mid-market regional player with established manufacturer relationships, the 90-day priorities shift toward digital platform investment, CRM implementation, and proactive engagement with potential strategic partners or acquisition targets.
Next Steps to Strengthen Your Market Position
The immediate priorities in the next 30 days are concrete: audit your current manufacturer relationships against the four criteria of exclusivity, allocation priority tier, pricing tier, and contract renewal timeline. Identify your weakest relationship and build a plan to either deepen it or replace it. Schedule a business review with your top two manufacturer partners and bring real market intelligence — project pipeline data, installer sentiment, competitive landscape observations — to demonstrate your value beyond transaction volume.
Your 90-day action plan should include one technology investment decision (inventory software, CRM, or e-commerce platform), one product portfolio expansion evaluation (assess BIPV or storage as a category addition), and one customer value-add initiative (installer training program, technical support hotline, or project design assistance service). None of these require large capital outlays to initiate, but each begins building the differentiated positioning that compound over time into a genuinely defensible market position.
Ready to Optimize Your Distributor Advantage in the Solar Supply Chain?
[Primary CTA] Download our exclusive “Solar Distributor Competitive Strategy Guide” to access negotiation templates for manufacturer contracts, inventory optimization frameworks, pricing strategy worksheets, and market analysis tools specific to your region.
[Secondary CTA] Explore how Jia Mao BIPV’s distributor and partner program can extend your product portfolio into high-margin BIPV categories — with full technical support, custom product specification services, and dedicated account management. Contact the Jia Mao BIPV distribution team →
📘 Glossary of Key Terms
Understanding these terms is essential for navigating the solar distribution landscape:
- BIPV (Building-Integrated Photovoltaics): Solar technology that replaces conventional building materials — glass facades, roof tiles, skylights — with PV-generating equivalents. Unlike conventional roof-mounted panels, BIPV serves a dual function: as both the building envelope and the energy generator.
- EPC (Engineering, Procurement, and Construction): Firms contracted to design, source equipment for, and build solar installations. Major distributor customers.
- Exclusive Territory Agreement (ETA): A contractual arrangement giving a distributor the sole right to sell a manufacturer’s products within a defined geographic area.
- MSRP: Manufacturer Suggested Retail Price — the list price from which all volume discounts and negotiated terms are calculated.
- PID (Potential Induced Degradation): A performance degradation mechanism in PV modules caused by voltage stress. Relevant for product quality differentiation.
- Safety Stock: The buffer inventory maintained above expected demand levels to protect against supply disruptions or demand spikes. Typically 15–25% of monthly sales volume in solar distribution.
- Tier-1 Manufacturer: A designation (commonly from Bloomberg NEF) indicating a manufacturer with a proven track record of financial stability, manufacturing quality, and bankability for project financing purposes.
❓ Frequently Asked Questions (FAQ)
Supply Chain & Inventory
1. How can I secure larger inventory allocations from manufacturers during shortage periods?
The most effective approach combines financial commitment with relationship depth. Manufacturers prioritize distributors who provide accurate, reliable demand forecasts (not inflated ones that undermine trust), demonstrate consistent order history and payment on time, and participate actively in manufacturer planning sessions. Putting volume commitments in writing — even quarterly targets with defined flexibility bands — signals seriousness that verbal agreements cannot. Distributors who have attended manufacturer annual partner conferences and contributed market intelligence data consistently report receiving 15–30% larger allocations during constrained periods than transactional buyers of equivalent historical volume.
2. What’s the best strategy for managing inventory when demand is unpredictable?
Layered demand management is the answer: implement demand forecasting software that incorporates leading indicators (permitting data, project pipeline, utility interconnection queues) rather than just lagging sales history. Maintain safety stock at 15–25% of monthly sales for your fastest-moving SKUs, and use just-in-time ordering for slower-moving or specialty items where carrying costs outweigh availability risk. Building concurrent relationships with three or more suppliers ensures you can shift sourcing within weeks rather than months when a primary supplier faces constraints.
3. How do I negotiate better terms with manufacturers as a mid-sized distributor?
Documentation is your most powerful tool. Before any negotiation, build a dossier: your geographic market share and growth trajectory over the past 24 months, a competitive analysis showing your performance relative to alternative channels in your territory, and a forward-looking volume commitment proposal with specific monthly targets. Presenting exclusive territory as a negotiation lever — particularly in markets where the manufacturer currently lacks focused distribution — consistently opens conversations that pure-price negotiations cannot. Manufacturers give better terms to distributors who make their planning easier; specificity and forward commitment are the currencies of that transaction.
4. What percentage of revenue should I allocate to inventory investment?
Industry benchmarks place inventory investment at 20–35% of annual revenue, with significant variation by product category, market maturity, and growth stage. Commodity modules in established markets trend toward the lower end; specialty products in developing markets or rapidly growing segments (BIPV, storage) may require higher investment to build category credibility. Cash flow stage matters enormously — a distributor in rapid growth mode may need to deploy 40%+ of revenue into inventory to capture market share, while a mature, stable operation may optimize closer to 18–22%. Consulting with your trade finance partners about inventory-backed credit facilities can effectively extend your inventory investment capacity without tying up working capital.
Pricing & Margin
5. How much margin can I realistically maintain in the current solar market?
Wholesale distributor margins on standard commodity modules have compressed to 8–15% in most markets, with ongoing downward pressure from consolidation and digital channel alternatives. Reseller and agent arrangements for specialty or BIPV products command 15–25% margins, with premium services (technical support, project design assistance, training programs) supporting the upper end of that range. The practical implication is clear: distributors whose entire portfolio consists of commodity modules face structural margin erosion that no operational efficiency can fully offset. Portfolio diversification into higher-margin specialty categories is not optional for long-term health — it is urgent.
6. What’s the best approach to competing on price without destroying margins?
Don’t compete on price at all — compete on total cost of ownership for your customer. An installer who buys from you at a 3% premium but receives same-day delivery confirmation, technical pre-sales support, no-hassle warranty processing, and access to a project design tool saves more in project management time and risk than the 3% price delta costs. The distributors who successfully hold margin premium in commodity markets invest in quantifying and communicating this value — building ROI models that demonstrate the real cost of a “cheaper” distributor relationship to installer customers who may not have done the math themselves.
7. How should I handle pricing pressure from larger competitors?
Segment your customer base and match your competitive response to the segment. Large-volume commodity buyers who are purely price-driven are likely to leave regardless — competing for them on price destroys margins for everyone else. Focus your defensive resources on mid-market customers with complex project needs, where your technical expertise and responsiveness create genuine switching costs. Simultaneously, build new capabilities in underserved niches where large competitors have not invested: BIPV for architectural projects, specialized storage configurations for commercial-industrial customers, or advanced inverter integration support for microgrid applications.
Market Access & Competition
8. How can I maintain market access if a manufacturer shifts to direct-to-consumer sales?
Build irreplaceable local capabilities that centralized manufacturer sales teams cannot cost-effectively replicate: last-mile logistics infrastructure, local credit relationships, language-native technical support, regulatory documentation expertise, and the accumulated trust of hundreds of installer relationships built over years. Manufacturers who shift to direct models for large accounts typically cannot replicate these capabilities at scale across all customer tiers. Pivoting to serve the mid-market and SME installer segment — precisely where manufacturer direct models are weakest — protects your volume base while the market repositions.
9. What should I do if a manufacturer is favoring larger competitors in allocation?
Request a formal business review meeting — not a sales call, but a structured strategy session — and bring documented evidence of the value your distribution creates: market coverage depth, installer network reach, brand investment, project reference list. Come with specific growth proposals: new territory targets, installer training commitments, co-marketing investments. If the relationship cannot be recalibrated, begin actively developing a competing manufacturer relationship in the same category as a genuine alternative. The credible threat of volume transfer is often more effective in improving allocation terms than any amount of negotiation without leverage.
10. How do I identify and develop new product categories to reduce dependency?
Start with your installer customers’ unmet needs, not manufacturer catalogs. Regular structured interviews with your top 20% of installer customers — questions about what they wish they could source from you that they currently buy elsewhere, what project types they’re pursuing that require new products, what technical challenges they face that no supplier currently helps with — reveal the most commercially validated category expansion opportunities available to you. BIPV, energy storage, EV charging infrastructure, and grid-edge monitoring are all categories where installer demand is running ahead of well-organized distribution coverage in most regional markets.
Strategic Planning
11. Should I invest in becoming a direct manufacturer representative?
This is a capital-structure question as much as a strategic one. Direct manufacturer representation typically requires equity investment in the relationship, minimum purchase guarantees, and dedicated sales resources. The ROI justification depends on the size of your addressable market, the exclusivity of the arrangement, and your operational capacity to deliver on the commitments. For distributors considering BIPV specifically, partnering with manufacturers like Jia Mao BIPV at the representative level provides access to a growing, high-margin category with the technical support infrastructure already established — reducing the investment and capability-building timeline compared to developing a new category from scratch.
12. What’s the optimal number of manufacturer relationships to maintain?
Most mid-sized distributors operate most effectively with 5–15 primary manufacturer relationships, organized into the three-tier model (primary, development, exploratory) described earlier in this guide. The quality and structure of each relationship matters more than the raw count: one exclusive primary relationship that delivers reliable allocation and competitive pricing outperforms five non-exclusive, non-committed relationships of the same aggregate volume. Monitor for concentration risk — if more than 40% of your revenue depends on a single manufacturer, you have a structural vulnerability that needs active management.
13. How should I prepare for consolidation in the distribution sector?
The most actionable preparation is building the assets that make your distribution business strategically valuable: documented exclusive territory agreements, quantified installer customer relationships (with customer lifetime value data), proprietary systems and processes that would take an acquirer 12–18 months to rebuild organically, and a clean, auditable financial track record. Distributors who treat consolidation as something that happens to other people consistently find themselves negotiating acquisitions from positions of weakness. Engaging proactively with the M&A landscape — including knowing the value of your business before you need to sell it — is sound strategic management, not premature surrender.
14. What technology investments should I prioritize to stay competitive?
The sequence matters: inventory management and forecasting systems first (highest ROI, most immediate competitive impact), CRM platforms second (relationship intelligence is the foundation of everything else), e-commerce and digital ordering third (customer experience and operational efficiency), data analytics fourth (the layer that synthesizes all of the above into actionable insight). Integration between these systems — ensuring that your inventory system talks to your CRM, which talks to your e-commerce platform — multiplies the value of each individual investment and should be a selection criterion when evaluating vendors.
Industry & Regulation
15. How are changing regulations and tariffs affecting distribution strategy?
Tariff volatility — particularly in the United States, where trade policy changes in 2025 generated what FTI Consulting called “major market disruption and uncertainty across global supply chains” — has made geographic sourcing diversification a strategic imperative rather than a risk management nicety. Distributors who source exclusively from manufacturers in a single country face cost volatility that cannot be hedged without multi-country supply agreements. Building relationships with manufacturers in multiple geographies (including, for the European and Asian markets, with specialized manufacturers like Jia Mao BIPV who can provide consistent documentation for import compliance) provides both cost stability and continuity of supply. Active engagement with industry associations — SEIA, SolarPower Europe, APVIA — for early intelligence on regulatory changes is also worth the membership investment for distributors at scale.
This article was developed with research support from IEA, SEIA, Solar Power Europe, IMARC Group, and FTI Consulting industry reports. For BIPV product specifications, distribution partnership inquiries, and technical support resources, visit www.jmbipvtech.com.