50x More Efficient Than Rooftop Solar? Inside the Promise and Reality of Window-Based Energy Generation
A comprehensive analysis of transparent solar technology’s performance claims, practical limitations, and commercial viability — written specifically for solar distributors, agents, and construction professionals evaluating this product category.
The Window Solar Revolution: Separating Marketing Claims from Market Reality
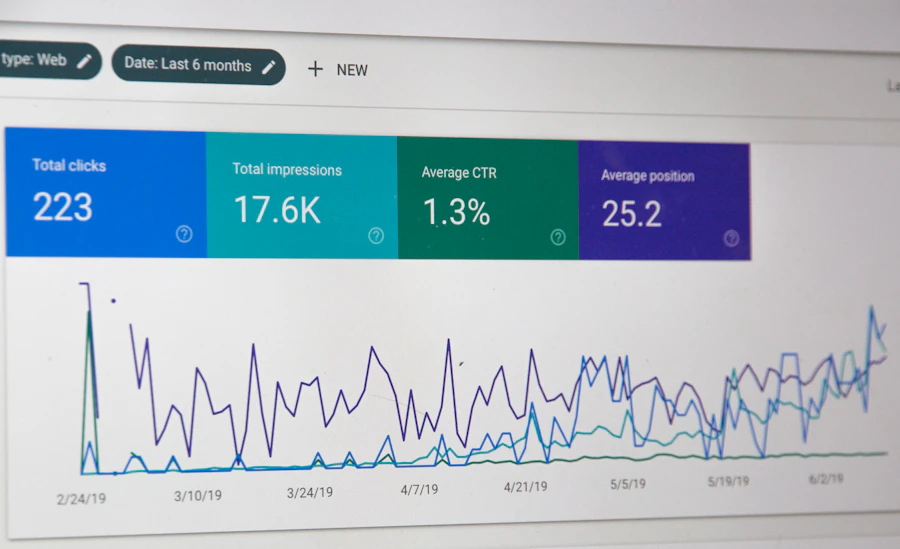
In 2015, Maryland-based SolarWindow Technologies published a model suggesting their transparent electricity-generating window coating could outperform conventional rooftop solar by a factor of 50. The claim circulated widely across the renewable energy press and has resurfaced repeatedly since. In 2025, it still appears in investor decks, distributor pitches, and manufacturer brochures — often stripped of the critical context that makes it meaningful.
For solar distributors and construction professionals, this matters. The transparent solar window category is real, commercially relevant, and growing. The global BIPV market reached $34.78 billion in 2025 and is forecast to exceed $164 billion by 2035. But distributing products in this space without understanding the gap between headline claims and field performance is a fast route to customer disputes, returned orders, and reputational damage.
This guide exists to close that gap. It does not dismiss window solar as a viable product — it demonstrably is, for specific applications. What it does is give distributors the analytical framework to evaluate claims accurately, set customer expectations correctly, and build a durable commercial position in this segment.

Section 1: Understanding Window-Based Solar Technology Fundamentals
How Transparent Solar Windows Actually Work
Transparent solar windows use the same fundamental principle as all photovoltaic technology — semiconductor materials that convert photon energy into electrical current — but with one critical engineering constraint: the panel must allow visible light to pass through while still generating electricity.
The solution is selective wavelength absorption. The semiconductor layers in transparent solar windows are engineered to absorb ultraviolet (UV) and near-infrared (IR) radiation — portions of the solar spectrum invisible to the human eye — while transmitting visible-range photons (400–700 nm wavelength). Since UV and near-IR together account for roughly 56% of total solar energy at the Earth’s surface, meaningful power generation is physically possible while maintaining visual transparency.
Organic Photovoltaic (OPV) Versus Traditional Silicon Cells
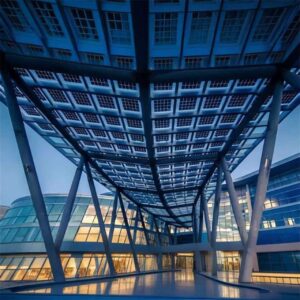
Organic photovoltaic (OPV) technology — which uses carbon-based semiconductor compounds rather than crystalline silicon — is the dominant approach in window solar applications. The reason is practical: OPV materials can be tuned at the molecular level to absorb specific wavelength ranges, deposited as ultra-thin coatings on glass surfaces, and manufactured in large-format sheets compatible with commercial glazing systems. Companies like Next Energy Technologies have demonstrated commercial-scale OPV window installations with six full-size 40×60-inch transparent PV windows installed at their headquarters in 2025 — a genuine commercial milestone, not a laboratory prototype.
Traditional crystalline silicon cells cannot be made transparent in the same way. Silicon absorbs across the visible spectrum, which is precisely why conventional panels are opaque. Thin-film silicon approaches (amorphous silicon) can achieve partial transparency at the cost of significantly lower efficiency, while emerging perovskite materials offer the most compelling theoretical pathway to high-efficiency transparent cells — but have not yet reached commercial-scale window applications.
📖 Key Technical Terms for Distributor Sales Conversations
- Organic Photovoltaic (OPV)
- A solar cell technology using carbon-based (organic) semiconductor molecules. Unlike silicon, OPV materials can be tuned to absorb specific light wavelengths, making them suitable for transparent window applications. Current lab efficiency records exceed 18%, though deployed window systems achieve 3–8%.
- Power Conversion Efficiency (PCE)
- The percentage of incident light energy converted to electricity. A 10% PCE panel converts 10W of every 100W of solar energy hitting it. This is the number manufacturers quote — often measured under standardised lab conditions that differ from field reality.
- Visible Light Transmission (VLT)
- The percentage of visible light that passes through the panel. Higher VLT = more daylight but generally lower power output. Window solar typically targets 50–80% VLT for commercial acceptability.
- Indirect / Diffuse Light
- Sunlight scattered by clouds, reflected by buildings, or bounced off interior surfaces. Window solar systems can generate power from diffuse light — a genuine advantage over rooftop panels optimized for direct irradiance. This is central to the “50x” claim logic.
- BIPV (Building-Integrated Photovoltaics)
- Solar technology that replaces conventional building materials. Window solar is a BIPV application — the panel IS the window, not an addition to it. This changes the economics significantly versus additive rooftop installations.
Light Transmission vs. Energy Conversion Trade-offs
This is the core physics constraint that every distributor must understand and communicate. There is an irreducible trade-off: every percentage point of visible light you allow to pass through is a percentage point of potential energy absorption you are forgoing. A fully transparent window solar panel (85%+ VLT) will always generate less power per square metre than a semi-transparent panel (50–65% VLT), which in turn generates less than an opaque panel.
The commercially relevant question is not “which has the highest efficiency?” but “which VLT level delivers the best economics for this specific building application?” A greenhouse roof may require 75%+ VLT for crop health. A commercial office facade may accept 60% VLT for higher power output. The distributor who helps customers navigate this trade-off intelligently — rather than selling on headline efficiency numbers — builds lasting relationships with professional buyers.
▶ An independent technical analysis of SolarWindow Technologies’ transparent electricity-generating window coating — covering how it works, what the claims mean, and where the technology currently stands. Essential viewing for distributor technical teams.
Section 2: Deconstructing the 50x Efficiency Claim
What “50x More Efficient” Actually Means
SolarWindow’s 50x claim, as published and subsequently referenced, is based on modelled performance of their coating applied to all glass surfaces of a 50-story commercial skyscraper — not a single window compared to a single rooftop panel. The comparison calculates total energy generated per unit of rooftop area available, not per square metre of active solar surface.
Here is the reasoning: a 50-story building may have 200 m² of rooftop surface available for solar panels but 20,000 m² of glass facade. If SolarWindow’s coating is applied to all 20,000 m² of glass at even modest efficiency, the total energy generation vastly exceeds what 200 m² of premium rooftop panels can produce — by approximately that 50x multiple when normalized to rooftop footprint. This is not a false claim. But it is a claim about total building energy potential at scale, not about panel-level efficiency — and that distinction is critical.
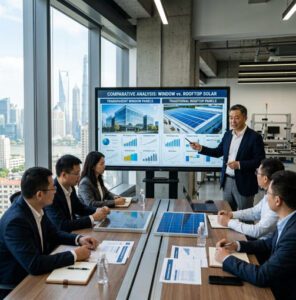
Comparing Apples to Apples: Window Solar vs. Rooftop Systems
| Performance Metric | Premium Rooftop Solar | Semi-Transparent PV Glass | OPV Window Coating |
|---|---|---|---|
| Lab Efficiency (PCE) | 20–24% | 8–15% | 3–10% |
| Real-World Deployed Efficiency | 15–22% | 5–12% | 3–8% |
| Power Output (W/m²) | 150–220 W/m² | 50–100 W/m² | 15–50 W/m² |
| Visible Light Transmission | 0% (opaque) | 70–90% | 60–85% |
| Performance in Diffuse/Indirect Light | Умеренный | Good | Very Good |
| Installation Method | Additive (onto roof) | Replaces glazing pane | Applied as coating to glass |
| Typical Payback Period | 5–10 years | 8–15 years | 15–25 years* |
| Long-Term Durability Data | Extensive (25+ yr field data) | Good (10–15 yr data) | Limited (early commercial stage) |
*Payback period for OPV window coatings may improve significantly with scale, incentives, and as avoided glazing costs are factored in. Figures reflect 2024–2025 commercial deployment data.
The Fine Print Behind Manufacturer Claims
When a manufacturer publishes an efficiency figure, three questions determine whether that number is commercially useful for your customers. First: was the test conducted under standard test conditions (STC) — 1,000 W/m² irradiance, 25°C cell temperature, AM1.5 spectrum — or under conditions optimised to produce the best result? Second: was the measurement taken on a full-size production panel or on a small laboratory cell? Small cells routinely outperform large-format modules by 20–40% due to edge effects and reduced internal resistance. Third: has the result been independently verified by an accredited third-party testing laboratory, or is it self-reported?
SolarWindow’s highest reported efficiency figure — 14.72% PCE announced in 2021 — was measured on a single small-cell configuration under lab conditions. This does not make it fraudulent, but it does mean the number is not directly comparable to the 15–22% efficiency figures quoted for commercial rooftop panels, which are measured on full-size production modules under IEC-standardised test protocols. Always ask manufacturers for large-format module test results verified by TÜV, Intertek, or Bureau Veritas — not cell-level laboratory measurements.

Section 3: Market Realities — Installation and Integration Challenges
Practical Deployment Obstacles for Distributors
The US Department of Energy’s BIPV challenge assessment identifies a structural problem that directly affects distributors: transparent solar products fall into a regulatory and commercial gap between the construction industry and the solar industry. The construction sector treats them as an electrical product and defers to solar specifications. The solar industry treats them as a building material and defers to construction codes. Neither sector has a mature procurement and installation workflow. For distributors, this means longer sales cycles, more complex project management, and a higher requirement for technical support than commodity solar.
Key deployment obstacles include building code compliance across two domains (glazing and electrical), structural load verification requirements that require a licensed engineer sign-off, compatibility with existing curtain wall and glazing frame systems, and inverter integration that must be specified and installed by a certified electrician in most jurisdictions. A distributor who sells window solar panels without having these downstream requirements mapped and communicated will generate installation failures and warranty claims.
Glazing Code Verification
Confirm the panel meets local building code requirements for safety glass (tempered/laminated), thermal performance (U-value, SHGC), and structural load capacity. Requirements vary by jurisdiction and building type — always obtain local approval before specifying.
Electrical Code Compliance
Window solar systems must meet NEC (US), BS 7671 (UK), or equivalent national electrical code requirements for PV systems. This includes grounding, overcurrent protection, and in some cases arc-fault protection. A certified electrician must verify and sign off on the electrical integration.
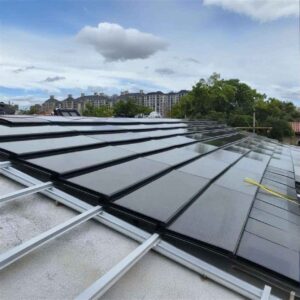
Structural Assessment
Photovoltaic glass panels are heavier than standard glazing — typically 20–40 kg/m². Existing curtain wall frames and window frames must be assessed for load capacity by a structural engineer before installation. This is especially critical in retrofits.
Inverter and Monitoring Specification
Window solar output (DC) must be converted to AC via compatible inverters. The choice between string inverters, microinverters, and DC power optimisers depends on system size, shading patterns, and monitoring requirements. Undersized or mismatched inverters are the most common cause of below-spec performance in BIPV installations.
Planning and Aesthetic Approvals
In conservation areas, listed buildings, or developments with architectural control panels, transparent solar glazing may require specific planning approval even though its appearance is minimal. Identify this requirement at the specification stage — not after procurement.
Building-Integrated Photovoltaics (BIPV) Market Maturity
Europe’s dominant position — at 41.8% of global BIPV revenue in 2025 — is not accidental. The EU’s Energy Performance of Buildings Directive mandates near-zero energy standards for new commercial buildings, creating regulatory pull for BIPV products that commodity rooftop installers cannot fully address. If your distribution territory includes European markets, window solar is not a niche product — it is increasingly a compliance requirement for new commercial construction clients.
Cost Structure and Pricing Strategy for Resellers
| Cost Component | Standard Rooftop Solar | Transparent PV Glass (BIPV) | OPV Window Coating |
|---|---|---|---|
| Materials (per m²) | $50–$120 | $150–$400 | $100–$250 (est.) |
| Installation Labour | Single trade (roofer + electrician) | Glazier + electrician (2 trades) | Specialist applicator + electrician |
| Replaces Existing Material? | No (additive) | Yes (replaces glazing) | Yes (coating on existing glass) |
| Planning / Permit Complexity | Умеренный | Moderate–High | Умеренный |
| Distributor Margin Potential | Low–Medium (commodity market) | High (specification product) | High (early-market positioning) |
| Sales Cycle Length | Short (1–4 weeks) | Long (3–12 months) | Long (3–12 months) |
The pricing strategy implication is clear: window solar is a premium specification product with a long sales cycle, not a volume commodity play. Distributors who position it correctly — leading with design-stage engagement with architects and developers, and supporting the full specification process — can achieve margins 2–3× higher than standard rooftop solar. Those who try to sell it at the procurement stage, competing on price alone, will lose to specialists every time. Explore how leading transparent solar panel products compare across windows and skylights to build your product evaluation framework.
Section 4: Return on Investment Analysis for Your Customers
Calculating True ROI: Beyond Efficiency Metrics
The payback period for window solar ranges from 8 to 25 years depending on four primary variables: electricity price in the installation market, annual solar irradiance at the specific location, the fraction of glazing installation cost avoided (i.e., whether the PV glass replaces glass that would have been installed anyway), and available financial incentives. Presenting any single payback figure to a customer without understanding these variables is commercially irresponsible — and will create disputes when actual performance deviates from projections.
The calculation changes materially when you account for avoided glazing costs. In a new commercial building where the client would have specified premium double-glazing regardless, the relevant comparison for window solar is not the full cost of the PV glass panel — it is the premium over standard glazing cost. In high-specification commercial projects, this premium is often $50–$150/m², reducing the effective capital outlay significantly and compressing the payback period.
Financial Incentives and Regulatory Support
In the United States, transparent solar windows qualify for the federal Investment Tax Credit (ITC) as photovoltaic components, though the residential ITC structure has been modified under 2025–2026 legislation — distributors should verify current rates with a tax specialist before quoting incentive benefits to customers. The commercial ITC for solar systems placed in service after 2022 and beginning construction before 2034 is 30%, with potential bonus credits for domestic content and energy community location requirements.
In Europe, national implementations of the EPBD create building-specific energy performance requirements that BIPV products can help meet — in some cases making them not merely financially attractive but structurally necessary for building permit compliance. Germany’s GEG (Building Energy Act), France’s RE2020, and the UK’s Future Homes Standard all create regulatory pull for integrated building energy generation that is directly addressed by window solar products. For distributors in these markets, the regulatory story is often more compelling than the financial ROI story.
Hidden Costs Distributors Must Communicate
Customers who are not informed of the full cost picture will feel deceived when the final invoice exceeds the quoted panel price. The most common hidden cost categories in window solar projects are: electrical infrastructure upgrades (new inverter, wiring, circuit breaker panel work) that can add $5,000–$25,000 to a commercial project; structural engineering sign-off fees; planning application and expediting costs in complex jurisdictions; monitoring system hardware and annual software subscription fees; and increased insurance premiums where the insurer treats the PV element as a specialist glazing component requiring enhanced coverage. Build these into every customer proposal — not as an afterthought, but as a demonstration that you understand the full project scope.
Section 5: Expert Analysis — What Independent Research Reveals
Third-Party Testing and Validation Results
The most comprehensive publicly available review of transparent solar PV technologies — published in Renewable and Sustainable Energy Reviews by researchers at the University of Adelaide — found that deployed transparent luminescent solar concentrators achieved less than 1% PCE despite 86% VLT; dye-sensitized solar cells reached up to 9.2% PCE at 60% transparency; and organic PV cells achieved 8.1% efficiency with 43.3% transparency in optimised configurations. The record transparent cell efficiency as of 2025 stands at 12.3% PCE with 30% VLT — a significant achievement but still well below the 15–22% efficiency routinely achieved by commercial rooftop silicon panels.
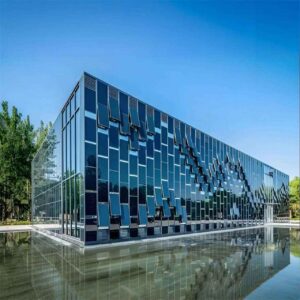
Next Energy Technologies’ commercial installation of 22 south-facade transparent OPV windows at a commercial building — the first verifiable large-format BIPV OPV installation — demonstrated that seamless integration into commercial buildings is achievable at current technology levels. Their windows cut energy use by 20–25% in modelled commercial building scenarios when accounting for both power generation and reduced HVAC load (from lower solar heat gain). This dual benefit — electrical generation plus thermal load reduction — is an important dimension of the commercial value proposition that pure efficiency comparisons miss.
The Gap Between Promise and Current Performance
The performance gap between laboratory cell records and real-world large-format deployment is not unique to window solar — it exists across all photovoltaic technologies. But the gap is proportionally larger for transparent OPV systems because: large-format modules have greater resistance losses across the transparent electrode; real-world glass orientation is rarely optimal; and current OPV encapsulation adds optical losses not present in small test cells. The practical takeaway for distributors is that manufacturer-quoted efficiency figures should be discounted by 30–50% when developing customer energy production models. Use 4–6% as your baseline planning efficiency for OPV window systems in customer-facing ROI tools until independent large-format field data is available for the specific product you are distributing.
Section 6: Market Positioning Strategy for Distributors and Resellers
Identifying Your Ideal Customer Profile
Window solar is not the right product for every customer, and a distributor who sells it to the wrong customer type will generate both financial and reputational damage. The building types where window solar consistently delivers commercially viable outcomes are large-format commercial facades in high-electricity-cost markets (retail, hospitality, office), greenhouse and agricultural operations where the dual benefit of power generation and optimised light management creates genuine crop yield and energy cost advantages, premium residential developments in jurisdictions with strong green building incentives, and new commercial construction projects where BIPV is included at the design stage and glazing costs are already in the budget.
The customer segments to approach with particular care — or to avoid until the technology matures further — are single-family residential retrofits (payback periods are too long for typical homeowner expectations), industrial buildings without glazing (no application surface), and customers seeking maximum energy output per dollar invested (rooftop silicon panels win this comparison decisively). Understanding which building types unlock the best window solar economics is the foundation of a defensible distribution strategy.

Competitive Differentiation in Your Sales Approach
The strongest competitive position for a window solar distributor is not “we sell the most efficient window solar panels.” It is “we are the advisor who helps you design the optimal hybrid energy system for your building.” This positioning removes window solar from direct head-to-head comparison with rooftop panels — a comparison it currently loses on pure efficiency grounds — and repositions it as a complementary component of a holistic building energy strategy.
Facade-mounted BIPV glass on a vertical south wall typically captures 60–70% of the energy of an optimally tilted rooftop system at the same location. A hybrid system that combines rooftop panels for maximum output with facade and window PV glass for aesthetics, compliance, and coverage of surfaces where traditional panels cannot go will outperform either system alone in total energy generation per dollar of available building surface. This is the design narrative that resonates with architects, developers, and building services engineers — and it is one that commodity solar distributors cannot credibly deliver. Visit Jia Mao BIPV’s 2026 review of glass-integrated solar panel and facade systems to build your product knowledge base for hybrid system design conversations.
Building Your Sales and Support Infrastructure
Selling window solar to professional buyers — architects, building services consultants, commercial developers — requires a fundamentally different sales infrastructure than commodity solar distribution. Your team needs working knowledge of glazing specifications (U-value, SHGC, VLT, safety glass classifications), BIPV electrical integration requirements, and building energy modelling basics. Without this, you cannot credibly engage at the specification stage where the decision is actually made.
Technical reference materials — including comparison datasheets, energy production modelling templates for different climate zones, and regional building code compliance checklists — should be developed as standard tools for your sales team. Partner with installers who have documented BIPV experience, not just general electricians or glaziers. Post-sale monitoring support — providing customers with quarterly performance reports that verify their system is generating as modelled — is the most effective retention and referral tool available in this market segment.
Section 7: Risk Assessment and Due Diligence Framework
Technical Risks and Performance Uncertainties
🔴 HIGH RISK: OPV Degradation Rate
Independent outdoor lifetime testing of OPV modules suggests lifespans of approximately 6 years under unencapsulated conditions, with encapsulated modules showing improved but still limited long-term field data. Crystalline silicon panels have 25+ years of validated field data. For OPV window products, demand detailed accelerated ageing test results and conservative warranty coverage before committing to a distribution agreement.
🔴 HIGH RISK: Manufacturer Financial Stability
Several early-stage window solar companies are pre-revenue or early-revenue businesses financed by equity raises rather than commercial sales. SolarWindow Technologies (WNDW) trades on the OTC Markets with limited commercial deployment. Distributor partnerships with pre-commercial manufacturers expose you to warranty orphan risk — the manufacturer fails, and you hold the customer relationship with no back-end support.
🟡 MEDIUM RISK: Technology Obsolescence
The window solar technology stack is evolving rapidly. Perovskite cells, if commercialised at scale within 3–5 years, could displace current OPV products with significantly higher efficiency. Distributors holding large inventory positions in current-generation products face potential markdown risk if next-generation products arrive faster than expected.
🟡 MEDIUM RISK: Regulatory Change
ITC structures in the US have already changed under 2025–2026 legislation. European EPBD implementation timelines vary by member state. Financial incentive calculations that underpinned customer proposals in 2024 may not be valid in 2026. Build review cycles into every long-dated project proposal.
🟢 LOWER RISK: Transparent PV Glass (BIPV Laminated)
Established transparent PV glass products from manufacturers with 10+ years of commercial deployment history — including crystalline silicon BIPV laminated glass — carry substantially lower technical risk than cutting-edge OPV coatings. This product segment has validated field data, established certification pathways, and documented degradation rates. It is the lower-risk entry point into the window solar market for distributors. See Jia Mao BIPV’s BIPV laminated glass for facades as a reference specification.
🟢 LOWER RISK: Market Growth Trajectory
At 19.5% CAGR through 2035, the BIPV market is one of the fastest-growing segments in the renewable energy sector. The demand direction is not in doubt — only the pace and specific technology mix. Distributors who build expertise and supplier relationships now are well-positioned regardless of which specific window solar technology achieves mainstream adoption.
Customer Satisfaction and Reputation Management
The most common cause of customer disputes in the window solar category is a gap between what was projected in the sales proposal and what the monitoring system actually records. In a market where independent performance benchmarks are limited and manufacturer claims are not always conservatively stated, this gap tends to be significant — often 20–40% lower actual generation than modelled.
The practical solution is to build a 20–30% performance buffer into every customer energy production model, use conservative irradiance data (10th-percentile year rather than average year), and present modelled output as a range rather than a single figure. Customers who are told “your system will generate 15,000–20,000 kWh per year” and receive 16,500 kWh are satisfied. Customers who are told “your system will generate 22,000 kWh” and receive 16,500 kWh are unhappy — and they will tell other potential customers.
Section 8: Future Outlook — When Window Solar Makes Commercial Sense
Technology Roadmap and Performance Improvements
The trajectory for window solar efficiency improvement is genuinely encouraging, but the timeline to commercial parity with rooftop silicon requires realistic assessment. OPV certified efficiencies have reached 18.2% at the cell level — though transparent window applications currently achieve 3–8% in field deployment. The gap represents a genuine technology development opportunity, not a fundamental physical barrier. Three to five years of continued materials research and manufacturing scale-up could plausibly bring deployed transparent window solar efficiency to 10–15% — a level at which the ROI proposition for commercial buildings becomes compelling without heavy reliance on regulatory incentives.
Perovskite materials, which achieved lab-scale transparent cell efficiencies exceeding 20% in 2024–2025, remain the most watched development. The American Ceramic Society’s 2025 perovskite progress report notes that commercialisation barriers — primarily moisture stability and lead content management — are being addressed through multi-junction architectures and lead-free material substitution. If perovskite window products reach commercial scale by 2028–2030 at 12–15% deployed efficiency, the window solar market will undergo a step-change in adoption rates that distributors positioned now will be best placed to capture.

Market Evolution and Adoption Scenarios
Strategic Recommendations for Your Business
The right moment to add window solar to your product portfolio is when you have confirmed three things: a clearly identified customer segment (commercial developers, greenhouse operators, or institutional property owners — not general residential), at least one manufacturer partner with third-party verified product certifications and documented commercial installations, and a trained sales and technical support team capable of engaging at the specification stage. Entering this market without all three will produce poor results regardless of product quality.
On inventory strategy: window solar products are project-specific, with custom dimensions and specifications the norm rather than the exception. Building large stock positions is not appropriate for most distributors. Instead, develop “specification-in, order-on-demand” workflows — where your team can support architects through the specification process and then trigger production orders against confirmed projects. This reduces inventory risk while maintaining the specification-stage engagement that generates business. Review the top BIPV products and their pricing and installation considerations to build your initial product range assessment.
Making Informed Decisions in a Rapidly Changing Market
Window-based solar technology is real, commercially deployed, and growing. The “50x” efficiency claim is not a lie — but it requires significant context to be useful, and that context is precisely what separates a distributor who can credibly sell this product from one who creates disappointed customers. The honest picture is: field efficiency of 3–8% for current OPV window systems, payback periods of 12–25 years without significant incentives, and a BIPV market growing at 19.5% annually that will reward early-mover distributors who build genuine expertise now.
Transparent PV glass products from established BIPV manufacturers — including the laminated glass and facade systems offered by Jia Mao BIPV — represent the lower-risk entry point into this market, with validated field data, established certification, and documented degradation profiles. They will not match the headline claims of cutting-edge OPV coatings, but they will consistently deliver what they promise — which is ultimately the foundation of a durable distribution business.
- Can you provide large-format module (not small cell) test results independently verified by TÜV, Intertek, or Bureau Veritas?
- What is the documented field efficiency of your installed commercial projects — not laboratory measurements?
- What is your manufacturing capacity, and what are current lead times for custom specifications?
- What glazing safety certifications (EN ISO 12543, ASTM E2188, or equivalent) does your product carry?
- What degradation rate do you warrant, and what is the basis for that warranty (field data vs. accelerated testing)?
- Do you have completed commercial installations with documented performance monitoring data you can share under NDA?
- What technical and sales training support do you provide to distribution partners?
- What is your financial backing and runway — and who holds the warranty obligation if the company is acquired or restructured?
Ready to Evaluate Window Solar for Your Distribution Business?
Build your due diligence process on real data, not marketing claims. Connect with BIPV specialists who can provide verified performance data, training support, and product ranges that match your market — from established transparent PV glass to next-generation facade systems.
Explore BIPV Product Range View Verified Case StudiesЧасто задаваемые вопросы
Answers to the questions solar distributors, builders, and their commercial clients most frequently raise when evaluating transparent window solar technology for real projects.
Performance data in this article reflects publicly available research, commercial deployment reports, and manufacturer specifications current as of mid-2025. All energy production projections should be validated through site-specific modelling before inclusion in customer proposals. For product specifications, distributor enquiries, and technical support, visit jmbipvtech.com.


-300x300.jpg)