Advanced Strategies to Maximize Your Building Integrated Photovoltaic (BIPV) Panel System: A Comprehensive Guide for Industry Professionals

The difference between a BIPV system that performs at 94% of design output at Year 10 and one at 82% is not the product — it is everything that happens after commissioning.
This guide is written for curtain wall and roofing contractors, photovoltaic EPC and energy service providers, building material brands and distributors, and architects, engineers, and design consultants. The strategies here address the operational challenges you face after the system is installed — where the real ROI is won or lost.
Installing a BIPV system is the beginning of the investment story, not the end of it. A 200 kW commercial BIPV facade generates approximately 280,000–360,000 kWh per year in a well-irradiated climate — representing $39,000–$50,000 in annual energy value at commercial rates. Over 25 years with 3% annual utility rate escalation, that is a cumulative energy value approaching $1.5 million from a single facade.
The difference between capturing that value in full and losing 15–25% of it to avoidable performance degradation, undetected faults, poor load alignment, and inadequate maintenance is operational discipline — not product selection.
Research is consistent: well-maintained solar installations retain 95% of original capacity after 20 years; poorly managed systems drop to 85% or lower. For a 500 kW BIPV project, that gap represents $250,000–$350,000 in lost generation value over the system’s lifecycle before accounting for warranty disputes, unplanned repair costs, and client relationship damage.
This guide delivers 10 advanced, actionable strategies — organized from real-time monitoring through long-term O&M partnerships — that transform a commissioned BIPV system into a managed, optimized, long-term asset. Each section is written for the professionals who actually deliver and maintain these systems.
Glossary: Key Terms at a Glance
Before diving in, here are the technical terms used throughout this guide, each defined on first use:
BIPV (Building-Integrated Photovoltaics): Solar modules embedded directly into the building envelope — glazing, cladding, roofing — replacing conventional materials while generating electricity.
PR (Performance Ratio): Actual energy output divided by theoretical maximum given current irradiance. A well-managed BIPV system targets PR ≥ 0.80 at Year 10.
P50 / P90: Statistical energy yield estimates. P50 = exceeded 50% of years (median); P90 = exceeded 90% of years (conservative guarantee basis).
MLPE (Module-Level Power Electronics): Microinverters or DC optimizers at each BIPV module, enabling per-module performance tracking and rapid shutdown.
BEMS (Building Energy Management System): Software controlling and monitoring a building’s energy-consuming systems — HVAC, lighting, plug loads — in real time.
Digital Twin: A virtual replica of a physical system that is continuously updated with real-world sensor data, used for simulation and operational planning.
EUI (Energy Use Intensity): A building’s annual energy use per square foot, used for LEED and BREEAM benchmarking.
IEEE 1547: The U.S. standard governing how distributed energy resources — including BIPV systems — connect and interact with the grid.
SLA (Service Level Agreement): A contractual commitment defining the minimum performance metrics, response times, and deliverables an O&M provider must meet.
1. Integrate Real-Time Performance Monitoring with AI-Driven Analytics
Why “Check the Dashboard Monthly” Is No Longer Acceptable
The operational gap that costs BIPV projects the most money is not dramatic system failures — it is gradual, undetected underperformance. A single failed DC optimizer reducing one string’s output by 30% generates an alert in a properly configured monitoring system within hours of the fault. In a system without monitoring, the same fault goes undetected for weeks or months — generating the same lost production daily, invisibly.
For a 200 kW commercial BIPV curtain wall with a properly configured string-level monitoring platform, the average fault-to-detection time is 4–8 hours. Without monitoring, field data across commercial portfolios suggests faults go undetected for an average of 47–90 days before a client notices the electricity bill is higher than expected.
At $0.14/kWh commercial rates, a single 30% string output reduction on a 15 kW string undetected for 60 days represents approximately $1,100 in lost energy value — plus the client conversation that starts from a position of eroded trust.
AI-Powered Fault Detection: What the Research Shows
A 2025 study published in Nature Scientific Reports demonstrated an AI fault detection framework for PV systems achieving 98.95% accuracy in identifying and classifying faults in real time — distinguishing between soiling, shading, module degradation, connection failures, and inverter faults from monitoring data alone, without physical inspection.
For EPC firms managing commercial BIPV portfolios, this capability changes the operational model fundamentally. Rather than dispatching a technician to investigate whenever monitoring shows an anomaly, AI-driven classification routes alerts directly to the correct resolution pathway:
- Soiling flag → schedule cleaning crew
- String output deviation → dispatch electrician for IV curve trace
- Inverter efficiency decline trend → flag for scheduled replacement within 90 days
- Communication dropout → check network hardware before assuming electrical fault
IoT Sensor Integration: Building the Data Foundation
IoT (Internet of Things): A network of physical sensors and devices that collect and transmit real-time data without human intervention.
IoT-enabled monitoring for commercial BIPV systems delivers data updated every 5–15 minutes at the module or string level. The hardware investment — pyranometers (irradiance sensors), temperature sensors, and string monitoring devices — runs approximately $0.05–0.12/W of installed capacity for a commercial system. That investment generates the data stream that makes AI-driven analytics possible.
The critical integration requirement that many EPC firms overlook: connect the monitoring platform to both the inverter data stream e an independent irradiance sensor. Without an on-site irradiance reference, the monitoring system cannot distinguish between a cloudy-day output drop (normal) and a fault-related output drop (requires action). This single oversight is responsible for a significant portion of false alarms that cause portfolio O&M teams to ignore valid alerts.
BIM and BEMS Integration for Lifecycle Visibility
Integrating the BIPV monitoring platform with the building’s BEMS creates a unified energy management view — real-time BIPV generation displayed alongside HVAC consumption, lighting loads, and meter data on a single dashboard. This integration enables:
- Self-consumption optimization: BEMS routes building loads to align with BIPV generation peaks, reducing grid import during high-generation hours
- Automated reporting: Monthly performance reports generated automatically from live data, requiring no manual compilation — a significant time saving for O&M teams managing 10+ sites
- Lifecycle documentation: Continuous performance data creates the evidence base that supports warranty claims, LEED O+M recertification, and investor ESG reporting
Jia Mao BIPV’s solar tile and glass facade product lines are designed with monitoring integration as a standard feature, not an afterthought — their systems support standard BACnet and Modbus TCP interfaces for direct BEMS connection on commercial projects.
2. Implement Predictive Maintenance Protocols

From Reactive to Predictive: The Data That Proves the Case
The financial argument for predictive maintenance in solar PV systems is now well-documented. Research on renewable energy sector predictive maintenance found that predictive strategies reduce emergency repairs by 80–90% while improving energy output by 15–25% compared to reactive-only approaches.
For a 300 kW commercial BIPV portfolio generating $126,000/year in energy value, a 15% output improvement from predictive maintenance represents $18,900/year in additional captured value — typically more than the annual cost of the predictive maintenance program itself.
The 2025 AI-driven maintenance framework published in TechRxiv demonstrated that ML models trained on historical performance data predict inverter failures 3–7 days in advance with 87% accuracy. That window transforms an emergency dispatch call — with all the mobilization cost and production loss it implies — into a planned replacement during a scheduled maintenance visit.
Soiling Rate Analysis: Cleaning on Data, Not Calendar
Soiling — the accumulation of dust, pollen, bird droppings, and atmospheric particulates on BIPV glass surfaces — reduces output by 5–15% annually in urban environments without regular cleaning. In arid or high-particulate climates (Middle East, Southwest U.S., India), unmanaged soiling losses can reach 20–25%.
The conventional approach — cleaning on a fixed quarterly or semi-annual schedule — is inherently inefficient. It cleans systems that don’t need it (wasting labor and water) and fails to clean systems that have been heavily soiled between scheduled visits (losing generation value daily).
AI-powered soiling rate analysis, as described in SmartHelio’s dynamic cleaning optimization research, uses monitoring data to calculate the real-time soiling rate for each facade zone and generates a cleaning work order only when the performance loss from soiling exceeds the cost of a cleaning visit. For a 200 kW commercial system, this approach typically reduces cleaning visits by 25–30% while maintaining higher average performance.
Micro-Inverter and Junction Box Health: The Continuous Checks That Matter
Four performance indicators — trackable through standard monitoring platforms — provide the earliest warning of developing electrical failures:
| Indicator | What It Signals | Action Threshold | Response |
|---|---|---|---|
| String voltage drift >3% from adjacent strings | Module fault or partial shading | Single occurrence | Run IV curve trace on affected string |
| Inverter conversion efficiency decline >0.5%/yr | Aging capacitors or power electronics | Sustained trend | Schedule replacement at next maintenance visit |
| Junction box temperature anomaly (IR scan) | Loose connection or failing bypass diode | >10°C differential | Inspect and re-torque within 14 days |
| Communication dropouts (inverter or MLPE) | Control board instability — precursor to failure | >2 events/month | Physical inspection within 5 business days |
3. Optimize Energy Usage Patterns via Smart Load Management
The Problem With Generating at Noon and Paying at 6pm
A BIPV facade generates its peak output between 10:00 AM and 3:00 PM on a clear day. In most commercial buildings, peak energy demand occurs between 7:00–9:00 AM (building startup, elevator activity) and 5:00–7:00 PM (HVAC peak, lighting, kitchen loads). Without active load management, a significant portion of BIPV generation exports to the grid at wholesale rates while the building imports grid power at retail rates during demand peaks.
In markets with significant time-of-use (TOU) rate structures — California, the U.K., Australia, and a growing number of U.S. utilities — the price differential between peak and off-peak electricity is $0.08–$0.18/kWh. Shifting 50 kWh/day of controllable building loads from peak to BIPV generation hours is worth $1,460–$3,285/year in avoided peak charges on a single commercial building.
Smart HVAC Integration: The Highest-Impact Load to Shift
HVAC systems represent 40–60% of commercial building energy consumption and offer the most manageable load-shifting opportunity. On buildings with BEMS integration, two automated strategies create immediate value:
Pre-cooling during BIPV peak generation: The BEMS activates additional cooling capacity during the midday BIPV generation window (10:00 AM – 2:00 PM), building thermal mass into the building envelope and reducing the need for grid-powered cooling during the late-afternoon demand peak. Studies of commercial building demand response programs document 8–15% peak demand reductions from well-executed pre-cooling strategies.
Demand response participation: The BEMS automatically responds to utility demand response signals by temporarily reducing HVAC setpoints during grid peak events — events for which utilities often pay commercial customers $50–$200/kW of curtailed demand. A building with 200 kW of HVAC load available for demand response participation can earn $10,000–$40,000/year in demand response payments, on top of BIPV generation revenue.
Time-of-Use Arbitrage with Battery Storage
For commercial buildings in high-TOU markets, pairing the BIPV system with a battery energy storage system (BESS) enables the most complete form of energy optimization: store excess midday BIPV generation, discharge during peak tariff hours, and minimize grid import during both demand and energy charge windows.
A properly sized BIPV + BESS system for a commercial office building in California can reduce electricity bills by 35–50% compared to a BIPV-only system — because the battery captures the generation that would otherwise export at $0.04/kWh and instead offsets imports that would cost $0.35/kWh during peak hours.
4. Design for Dual Functionality: Energy + Building Envelope Performance
The ROI Calculation Most Project Teams Miss
When BIPV glass is evaluated solely as an energy generation system, its economics look marginal compared to rack-mounted rooftop PV. When it is evaluated as a combined energy + building envelope system, the calculation changes fundamentally.
A well-specified semi-transparent BIPV curtain wall unit simultaneously delivers:
- Electricity generation: 80–150 Wp/m², generating 60–160 kWh/m²/year depending on orientation and climate
- Thermal insulation: U-values of 1.0–1.8 W/m²K, reducing heating and cooling loads vs. standard clear glass (U-value 5.8 W/m²K)
- Solar heat gain reduction: SHGC of 0.15–0.35 vs. 0.86 for clear glass — reducing cooling loads by 18–40% in cooling-dominated climates
- Acoustic performance: Rw 35–45 dB from laminated glass construction — meeting or exceeding standard curtain wall acoustic requirements
- Shading: The facade itself becomes a passive shading device, reducing interior glare and direct beam radiation on occupants
A 2024 ScienceDirect study on vacuum amorphous silicon BIPV curtain walls in Harbin’s climate demonstrated a 75% reduction in cooling load e 32% reduction in heating load compared to standard clear glass — with electricity generation on top of those HVAC savings.
For a 10,000 m² commercial office building replacing standard glazing with BIPV glass, the combined HVAC savings can represent $45,000–$90,000/year in avoided cooling and heating costs — an energy benefit that never appears in a standalone BIPV financial model but is fully real.
Specifying for Maximum Envelope Performance
EPC contractors and architects coordinating BIPV specifications should confirm the following thermal and acoustic values from the manufacturer before finalizing the specification:
| Performance Parameter | Target for Cooling-Dominated Climates | Target for Heating-Dominated Climates | Standard to Reference |
|---|---|---|---|
| U-value (thermal transmittance) | ≤1.8 W/m²K | ≤1.0 W/m²K | ASHRAE 90.1-2022 |
| SHGC (solar heat gain coefficient) | ≤0.25 | 0.35–0.45 | ASHRAE 90.1-2022 |
| Visible Light Transmittance (VLT) | 20–40% (vision zones) | 25–45% (vision zones) | Project spec |
| Acoustic (Rw) | ≥37 dB for urban locations | ≥35 dB | EN ISO 10140 |
5. Standardize Installation Protocols Across Project Types
The Rework Problem: Where Unstandardized Installations Fail
Across BIPV projects managed by multiple subcontractors — curtain wall crews handling the glazing scope, electrical subs handling PV wiring, and roofing specialists handling waterproofing interfaces — the most consistent source of rework cost is undefined scope boundaries at trade interfaces.
The question “who installs the conduit sleeve through the mullion?” answered differently by three different projects results in three different inspection outcomes and at least one costly correction. Standardizing the answer — documented in a contractor-facing installation protocol reviewed and signed before mobilization — eliminates this variable.
Contractor Installation Checklist — Before First Panel Is Installed:
- Structural engineer has confirmed dead load capacity for specified BIPV glass weight (document the PE-stamped calculation, file number)
- All conduit routes are marked on the structural framing and approved by the electrical engineer before glazing installation begins
- Junction box access locations are confirmed against interior finish drawings — access panels sized and located
- Manufacturer technical representative is scheduled for the first installation sequence (Day 1 of panel installation)
- Crew has completed DC electrical safety training — confirm OSHA 10 or equivalent and manufacturer DC arc flash briefing
- Vacuum lifter capacity rating is confirmed for the heaviest BIPV panel in the specification (typically 25–45 kg/m²)
- Approved sealant product list is confirmed with the BIPV glass manufacturer — incompatible sealants void weather warranties
- String mapping drawing is issued with each panel’s string assignment labeled
Training: What “BIPV-Certified” Actually Means in Practice
NABCEP’s PV Installation Professional (PVIP) certification is the baseline electrical credential for PV work in the U.S. All crew members performing DC electrical scope — string wiring, junction box connections, combiner box work — should hold PVIP or be directly supervised by a PVIP holder.
Beyond NABCEP, most established BIPV manufacturers — including Jia Mao BIPV, Onyx Solar, and Schüco — offer product-specific installation training that covers handling protocols, torque specifications, sealant application, and electrical connection sequences specific to their product. These trainings are frequently offered at no charge for projects above a minimum order threshold and result in a certified installer designation that the manufacturer recognizes for warranty purposes.
The business case for manufacturer training is concrete: certified installation crews average 15–25% fewer warranty callbacks than non-certified crews on identical product installations — a number documented across commercial installer networks. At an average callback cost of $2,000–$5,000 per event, the training investment pays back on the second callback avoided.
6. Leverage Digital Twins for System Lifecycle Optimization

A digital twin of a BIPV system lets you find the Year 12 problem in Year 1 — when fixing it costs a fraction of the reactive alternative.
What a BIPV Digital Twin Actually Is
A Digital Twin is a continuously updated virtual model of a physical system — in this case, a BIPV facade or roof installation — that combines real-world monitoring data with simulation models to reflect the system’s actual current state and predict its future behavior.
The distinction from a static energy model (like a PVsyst simulation run at design stage) is crucial: a digital twin is live. As the monitoring system records actual production data, the twin updates its model parameters — degradation rate, soiling characteristics, inverter efficiency — to reflect what the physical system is actually doing, not what it was theoretically expected to do.
A 2024 ScienceDirect review of BIM-to-digital-twin integration in BIPV, published in the journal Renewable Energy, identified the following as primary operational benefits of digital twin deployment across the BIPV project lifecycle:
- Design optimization: Simulating facade geometry, module placement, and string architecture before physical installation to maximize yield
- Performance monitoring: Comparing real-time monitoring data to the twin’s predictions to identify deviations that require investigation
- Degradation forecasting: Projecting Year 10, Year 15, and Year 25 performance based on actual observed degradation rate — not assumed rate — enabling accurate long-term financial reporting to building owners and investors
- Retrofit planning: Testing module replacement scenarios, inverter upgrades, or BESS additions virtually before committing capital
Simulating 25+ Years of Degradation
The IEA PVPS Technical Guidebook (2025) confirms that crystalline silicon BIPV module degradation rates vary from 0.4% to 0.9% per year depending on technology, climate exposure, and maintenance quality. That range — which appears narrow — produces a meaningful output difference at Year 25:
| Annual Degradation Rate | Year 10 Output (% of rated) | Year 25 Output (% of rated) |
|---|---|---|
| 0.4%/year (premium, well-maintained) | 96.1% | 90.6% |
| 0.6%/year (industry median) | 94.2% | 86.1% |
| 0.8%/year (reactive maintenance, sub-optimal) | 92.3% | 81.8% |
| 1.0%/year (poor maintenance, coastal exposure) | 90.4% | 77.8% |
For a 500 kW BIPV system generating $210,000/year in Year 1, the difference between 0.4% and 1.0% annual degradation represents $415,000 in cumulative generation value over 25 years — a gap that a digital twin, by accurately tracking actual degradation rate and triggering maintenance when rates exceed thresholds, is designed to close.
7. Align BIPV Specifications with Material Supply Chain Capabilities
The Lead Time Problem Nobody Plans For Until It’s Too Late
Custom BIPV glass — manufactured to project-specific dimensions, VLT, color, and electrical configuration — requires 12–20 weeks from confirmed purchase order to site delivery in standard production runs. Non-standard configurations (unusual module formats, custom ceramic frit patterns, structural certification to project-specific loads) can extend this to 20–28 weeks.
That timeline sits almost always on the critical path for curtain wall installation. The contractor who places the BIPV glass order after design is “complete” — typically at 90% construction documents — has already built a 3–5 month schedule delay into the project before installation begins.
The correct procurement trigger is design development completion (60% CD), not construction documents issuance. At that stage, module dimensions, VLT, color, and electrical configuration are defined with sufficient precision to place a binding order — with allowance for minor adjustments in the final 10% of design that do not change fabrication parameters.
A custom structural glazing procurement guide confirms that custom facade glazing requires 16–30 weeks from design finalization to site delivery — BIPV glass sits at the upper end of this range. Early coordination is not optional — it is a schedule management requirement.
Co-Developing Custom Profiles with Glazing Suppliers
For EPC firms and curtain wall contractors running multi-project BIPV programs, co-developing standardized BIPV product profiles with a primary supplier creates a procurement advantage that compounds over time.
A framework supply agreement — defining annual volume commitments, preferred pricing tiers, priority production slots, and technical support scope — with a manufacturer like Jia Mao BIPV delivers three specific operational benefits:
- Price certainty: Fixed unit pricing for 12–24 months, insulating the project portfolio from raw material (glass, silver paste, encapsulant) cost volatility
- Lead time reliability: Reserved production capacity ensures the manufacturer can accommodate the firm’s order volumes without queue delays during market demand peaks
- Technical continuity: A consistent product platform across multiple projects allows engineering teams to reuse structural calculations, NFPA 285 compliance documentation, and BIM component libraries — eliminating redundant engineering work project-by-project
Reducing Project Delays from Component Mismatches
The most preventable supply chain failure on BIPV projects is component incompatibility discovered on-site — a DC connector standard from one production batch that doesn’t mate with an adjacent batch’s connector, or a sealant product that creates compatibility issues with the manufacturer’s edge seal system.
Prevention is straightforward but requires explicit specification:
- Define the MC4 connector brand and model in the BIPV product specification — not “MC4-compatible”
- Confirm sealant compatibility in writing with the BIPV glass manufacturer before procurement — request the approved sealant list, not just the sealant type
- Order all modules for a given facade zone from a single production batch to ensure color matching and electrical characteristic consistency
Watch: BIPV Glass Engineering Principles and Optimization for EPC Professionals
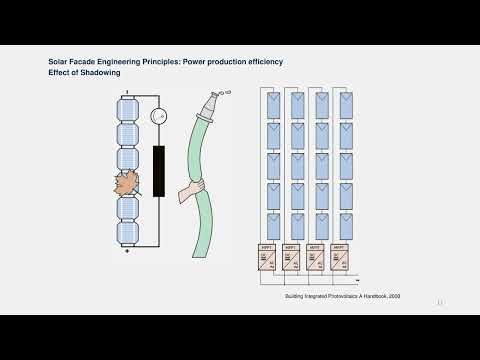 Click to watch: A technical overview of BIPV engineering principles covering structural integration, electrical safety, and performance optimization — relevant for EPC firms, curtain wall contractors, and design engineers coordinating BIPV facade projects.
8. Incorporate Performance Guarantees into EPC Contracts
P50 vs. P90: The Numbers That Protect Client ROI
P50 is the energy yield that the system is expected to exceed in 50% of years — the median output. P90 is the yield exceeded in 90% of years — a more conservative figure that accounts for weather variability and model uncertainty. For commercial clients and lenders, P90 is the yield guarantee basis that makes a project financeable.
A 2025 analysis of EPC performance guarantees confirmed that performance guarantee structures with liquidated damages are standard practice in commercial solar EPC contracts — and that the EPC’s exposure under those guarantees is directly determined by the accuracy of the original yield model.
The risk is asymmetric: if PVsyst projects P50 at 350,000 kWh/year and the guarantee is set at P90 – 5%, the EPC must ensure the model is accurate. A 5% optimistic PVsyst projection means the guarantee threshold is set 10% above what the system will actually deliver in most years — a recipe for liquidated damages payments.
Defining the Performance Guarantee Structure
A well-structured EPC performance guarantee clause includes four elements:
1. Baseline yield definition: “The system shall generate no less than [X] kWh during the 12-month period following Substantial Completion, as measured by the revenue-grade production meter at the AC output of the inverter system.”
2. Adjustment mechanism: Performance is normalized against actual site irradiance measured by the on-site pyranometer — adjusting the guarantee threshold up or down if actual weather conditions deviate from the modeled weather year. This prevents the EPC from paying damages because of an unusually cloudy year.
3. Liquidated damages rate: “For each kWh of shortfall below the guaranteed yield, the EPC shall pay the building owner $[X] per kWh, representing the building owner’s avoided cost of grid electricity.” Typical rates: $0.10–$0.18/kWh.
4. Exclusions and force majeure: Guarantee performance is measured excluding periods of utility grid outage, force majeure events, and building owner failure to maintain the system per the O&M protocol.
Third-Party Commissioning: The Guarantee That Holds Up
A performance guarantee is only as credible as the commissioning data that establishes the baseline. Third-party commissioning — conducted by an independent engineer not affiliated with the EPC — produces commissioning documentation that is:
- Accepted by lenders and investors as the performance baseline for bankable guarantees
- Admissible in warranty and performance dispute resolution
- Structured per IEC 62446-1 requirements, covering IV curve testing, insulation resistance, and PR verification
The cost of third-party commissioning on a commercial BIPV project — typically $4,000–$12,000 — is the investment that makes the performance guarantee defensible. EPCs who skip it and conduct only internal commissioning face a higher risk of guarantee disputes precisely because they lack independent baseline documentation.
9. Future-Proof Systems for Grid Interoperability and Storage Integration
Pre-Wiring for Battery Storage: The $15,000 Decision That Saves $60,000
The capital cost of installing battery-ready electrical infrastructure during BIPV system construction — oversized DC conduit, battery combiner box rough-in, pre-wired DC disconnect — is approximately $8,000–$20,000 on a commercial 200–500 kW project. The capital cost of retrofitting that same infrastructure after the building is occupied and finishes are complete: $45,000–$85,000, including demolition, patching, repainting, and tenant coordination.
This is the most financially compelling argument for future-proofing during initial BIPV installation. Battery storage economics are improving rapidly. In markets where battery system costs are below $400/kWh installed (already achieved in several U.S. and European markets), the BIPV + BESS configuration delivers positive NPV on Day 1. Buildings that installed battery-ready infrastructure in 2025 will be able to add storage at 2028 or 2030 economics without a disruptive retrofit.
Pre-wiring decisions that require minimal incremental cost at construction but create significant future optionality:
- Upsize DC conduit from minimum code size to 150% of current capacity (conduit cost difference: $2–$4/linear foot; retrofit cost: $40–$70/linear foot)
- Install battery combiner box rough-in with blanked knockout panels
- Specify modular string inverters (not monolithic central inverters) — modular units can be augmented with additional inverter modules as storage is added, rather than replaced
- Pre-wire EV charging conduit from the BIPV electrical room to the parking level during construction
IEEE 1547 Grid Interoperability Compliance
IEEE 1547-2018 is the U.S. standard governing how distributed energy resources — solar, storage, and their combinations — connect, communicate, and interact with the utility grid. For commercial BIPV systems commissioning in 2025 and beyond, IEEE 1547-2018 compliance is a utility interconnection requirement in most U.S. service territories.
Key IEEE 1547 requirements that affect BIPV system design:
- Voltage and frequency ride-through: Inverters must maintain operation through specified voltage and frequency disturbances rather than tripping offline (the old requirement). This protects grid stability during faults but requires inverter models explicitly certified for IEEE 1547-2018 ride-through.
- Reactive power capability: Inverters must be capable of providing reactive power support (volt-VAR response) on utility command — a grid stability service that some utilities are beginning to compensate distributed generators for providing.
- Interoperability communication: IEEE 2030.5 or SunSpec Modbus communication profiles are required for IEEE 1547-2018 compliant utility interconnection in several major territories.
Verify inverter IEEE 1547-2018 certification before procurement — not all inverters marketed as “grid-tied” comply with the 2018 edition’s requirements. The utility interconnection application will identify the specific standard edition required for the service territory.
10. Establish Long-Term O&M Partnerships with Performance-Based SLAs
Why Flat-Fee O&M Contracts Create the Wrong Incentives
A flat-fee O&M contract — “we’ll visit the site four times per year for $X,000 annually” — aligns the service provider’s incentive toward minimum effort, not maximum performance. The provider earns the same fee whether the system generates 95% of design output or 80%.
Performance-based SLAs align incentives correctly: the O&M provider earns more when the system performs better, and has financial exposure when it underperforms. This structure, which has become standard in large-scale utility solar O&M contracting, is now filtering into commercial BIPV portfolios as building owners and EPC firms demand greater accountability from their service partners.
Tiered O&M Package Structure
Design O&M offerings in three tiers that match client sophistication and risk tolerance:
| Tier | Service Scope | Pricing Basis | Target Client |
|---|---|---|---|
| Basic (Tier 1) | Remote monitoring access, annual inspection report, email alerts | Flat annual fee per kWp | Small commercial, cost-sensitive clients |
| Standard (Tier 2) | Monitoring + quarterly reports + 48-hour fault response SLA + annual thermographic scan | Flat fee + per-callout rate for additional site visits | Mid-size commercial, institutional clients |
| Premium (Tier 3) | All Tier 2 + guaranteed system availability ≥98%, predictive maintenance program, annual performance audit, LEED O+M documentation | Base fee + performance bonus for outperformance above P75 | Large commercial portfolios, REITs, ESG-reporting clients |
The performance bonus structure in Tier 3 is the design element that creates a genuine partnership: the O&M provider earns additional revenue when active performance optimization — cleaning scheduling, predictive maintenance, load management recommendations — produces measurably better generation outcomes.
Performance Metrics That SLAs Should Define
Every performance-based SLA should specify the following metrics in measurable, unambiguous terms:
- System availability: Target ≥98% of generation hours; defined as the percentage of time the system is generating within 5% of irradiance-adjusted expected output
- Fault response time: P1 (immediate safety risk) = 4 hours; P2 (significant output loss) = 24 hours; P3 (monitoring or minor issue) = 5 business days
- Annual performance report delivery: Delivered within 30 days of the contract year-end, including actual vs. modeled generation, performance ratio trend, corrective actions taken, and forward maintenance recommendations
- Warranty claim processing: O&M provider initiates warranty claims on behalf of the building owner within 10 business days of identifying a warranty-eligible defect
Annual Performance Audits: What Stakeholders Actually Need
Building owners, investors, and lenders who have financed BIPV systems need annual evidence that the asset is performing as underwritten. An annual performance audit that serves these stakeholders contains:
- 12-month generation summary: Actual kWh vs. P50 modeled kWh, with variance explanation (weather-normalized performance ratio)
- Degradation trend analysis: Year-over-year PR decline, compared to the expected 0.4–0.6%/year degradation trajectory
- Corrective maintenance log: All faults identified, response times, resolution descriptions, and any recurring failure patterns
- Warranty status summary: Current warranty coverage for all major components, with any claims in progress
- Forward maintenance budget: Recommended capital expenditure for the next 12 months based on component age and predictive maintenance data
This document — structured for a building owner’s board or an investor’s asset review — is the deliverable that justifies the O&M relationship and demonstrates professional-grade management of a building asset. Jia Mao BIPV’s technical support team provides manufacturer-side input to these annual reviews for systems using their products, including updated degradation benchmarks and component lifecycle guidance.
BIPV System Optimization: Performance Impact Summary
| Strategy | Implementation Cost | Annual Value Created | Payback Period |
|---|---|---|---|
| AI-powered real-time monitoring | $0.05–0.12/W installed | 8–15% output recovery from early fault detection | <12 months |
| Predictive maintenance program | $8,500–$15,000/yr (200 kW system) | 15–25% output improvement vs. reactive-only | 12–18 months |
| Smart load management (BEMS + TOU) | $15,000–$40,000 integration | $8,000–$35,000/yr in tariff optimization | 1–3 years |
| Battery storage pre-wiring | $8,000–$20,000 upfront | Saves $45,000–$85,000 retrofit cost later | <6 months (avoided cost) |
| Standardized installation protocols | $2,000–$5,000 in training | Reduces warranty callbacks 15–25% | <6 months |
| Performance-based SLA | O&M fee increase of $2,000–$8,000/yr | Guaranteed system availability ≥98% | Ongoing |
All values are illustrative based on a 200–500 kW commercial BIPV portfolio. Project-specific analysis required.
Perguntas frequentes
1. How can BIPV systems be monitored effectively across multiple building sites?
Use a centralized cloud-based monitoring platform with API integration into each site’s inverter data stream and the portfolio management system. Leading platforms — SolarEdge, Enphase Enlighten, and independent SCADA systems compliant with IEC 61724 monitoring standards — support multi-site dashboards with portfolio-level performance roll-ups, site-level drill-down, and automated alert routing to regional O&M teams. The key integration requirement: each site needs an independent irradiance sensor so the platform can weather-normalize performance comparisons across geographically dispersed sites.
2. What are the most common causes of BIPV underperformance in curtain wall installations?
Three causes account for the majority of documented underperformance on curtain wall BIPV systems. First, shading from floor slabs, parapets, or adjacent structures that was not fully captured in the design-stage shading analysis — creating string-level losses disproportionate to the shaded area. Second, incorrect string architecture that combines modules from different facade orientations in the same series string — forcing all modules to operate at the worst-performing module’s current. Third, inadequate thermal expansion joint sizing in the curtain wall framing, which creates sealant failures that cause moisture ingress at panel edges, accelerating encapsulant degradation and raising electrical resistance in affected modules.
3. How do I ensure BIPV compliance with local building and fire codes?
Build the compliance framework before the product is specified — not at permit submission. For U.S. commercial projects: confirm the adopted NEC edition with the AHJ, request NFPA 285 fire test documentation for the specific wall assembly from the BIPV manufacturer, verify UL 61730 listing for the module, and confirm IEC 63092-1 certification for the BIPV-specific performance requirements. For EU projects: CE marking, EN 13501 fire classification for the assembly, and EPD documentation for LEED/BREEAM submissions. UL’s BIPV certification services cover the full U.S. compliance pathway.
4. Can BIPV replace traditional cladding without compromising structural integrity?
Yes, when the structural design accounts for the BIPV glass dead load from the outset. BIPV glass panels are heavier than standard IGUs — typically 25–45 kg/m² for laminated curtain wall configurations versus 18–22 kg/m² for standard double-glazed units. For new construction, the structural engineer sizes framing members and anchor systems for this load from day one. For retrofit applications, a PE-stamped structural assessment of the existing curtain wall frame and building slab edge is required before specification. Most modern commercial curtain wall systems installed after 2005 have sufficient reserve capacity to accommodate BIPV glass without reinforcement — but this must be verified, not assumed.
5. What maintenance schedule is recommended for commercial BIPV systems?
The professional standard for commercial BIPV in urban environments: quarterly visual inspection with documented findings; semi-annual facade cleaning with deionized water and soft-bristle equipment (no pressure washing); annual electrical inspection covering string Voc/Isc measurements, insulation resistance testing, and IR thermography; and 5-year structural inspection of curtain wall fixings and drainage channels. In coastal, arid, or high-particulate environments, increase cleaning frequency to quarterly or monthly based on soiling rate monitoring data. All inspections must be documented with technician certification records and geo-tagged photographs to maintain warranty compliance.
6. How can architects specify BIPV without delaying design timelines?
The most effective approach is using the manufacturer’s pre-certified product library — standard module dimensions, tested assembly configurations, and existing NFPA 285 and IEC certification documentation — to write a performance specification rather than a proprietary specification. This approach allows multiple qualified BIPV suppliers to bid against defined performance criteria, shortens review cycles at the building department (pre-certified assemblies require less project-specific engineering analysis), and gives the architect design flexibility within a certified envelope. Engage the BIPV manufacturer’s technical representative at schematic design — not design development — to receive BIM component families, structural load data, and color samples before any design decisions are locked.
7. What ROI can building owners expect from commercial BIPV integration?
Commercial BIPV projects in well-irradiated markets with U.S. ITC applied typically deliver IRR of 7–12% over 20 years, with payback periods of 6–12 years depending on electricity rate, building orientation, and incentive stack. The financial model improves when the comparison correctly credits the replaced conventional cladding cost — a 1,200 m² BIPV curtain wall replacing $280/m² standard glazing generates a $336,000 material offset that reduces the net BIPV investment and compresses the payback period. Combine with C-PACE financing (100% coverage of eligible costs, repaid over 20 years through a property tax assessment) and the BIPV system generates positive cash flow from Day 1 in many U.S. markets.
8. How do BIPV systems perform in low-light or diffuse-light conditions?
Modern monocrystalline BIPV modules maintain approximately 70–80% of STC-rated efficiency under diffuse (overcast) light conditions — an important characteristic for northern European, Pacific Northwest, and Southeast Asian markets where direct beam radiation accounts for a smaller fraction of total annual irradiance. Amorphous silicon thin-film BIPV performs even better under diffuse conditions, maintaining 85–90% efficiency relative to peak, making it the preferred technology for consistently overcast climates. The Powerhouse Brattørkaia in Trondheim, Norway — at 63°N latitude — generates over 500,000 kWh/year from approximately 3,000 m² of BIPV, demonstrating viable performance well beyond the “solar belt.”
9. Can BIPV be integrated with energy storage for off-grid or resilience applications?
Yes. The optimal configuration for resilience applications is DC-coupled storage — where the battery system connects directly to the BIPV array’s DC output, bypassing the DC-to-AC conversion step that reduces round-trip efficiency by 5–8%. DC coupling maintains system efficiency of 90–95% for the charge/discharge cycle, compared to 82–88% for AC-coupled configurations. For BIPV systems designed from the outset with storage in mind, DC coupling requires the inverter to be a hybrid unit capable of managing both BIPV array charging and battery discharge — confirm this capability in the inverter specification before purchase. A well-designed BIPV + BESS system provides 4–12 hours of critical load coverage depending on battery sizing — a resilience asset that is increasingly valued by healthcare, data center, and institutional clients.
10. What are the best practices for grounding and lightning protection in BIPV facades?
Follow IEC 62305 for lightning protection system design — the international standard covers risk assessment, protection levels, and bonding requirements for BIPV facades. Key practical requirements: all BIPV metal framing components (mullions, transoms, panel frames, mounting hardware) must be bonded with continuous equipment grounding conductors at each structural connection point. The bonding path from the uppermost module frame to the building’s grounding electrode must have total resistance <0.5 Ω, verified with a low-resistance ohmmeter after installation. Lightning down-conductors, where required by risk assessment, must be routed to avoid the DC wiring runs — parallel routing of lightning conductors and DC cables creates induction hazards. For high-rise buildings in high-lightning-incidence zones (Florida, the Gulf Coast, Singapore), engage a lightning protection specialist during schematic design — not after the electrical drawings are complete.
11. How do I handle warranty claims when BIPV modules fail prematurely?
The three elements that determine whether a warranty claim succeeds: a clear failure mode documentation (EL imaging before module removal, IV curve trace of the failing string, thermographic evidence of the hotspot condition), maintenance compliance records demonstrating that the system was serviced per the manufacturer’s protocol (inspection logs, cleaning records, technician certifications), and the original commissioning report establishing the baseline against which degradation is measured. Claims that fail almost always fail on one of these three documentation requirements — not because the failure wasn’t genuine. Maintain digital records throughout the system’s operational life, structured for exactly this eventual use.
12. Are there BIM objects and technical specs available for common BIPV products?
Yes. Leading BIPV manufacturers — including Jia Mao BIPV, Onyx Solar, and Polysolar — provide Revit families (BIM component files) for their product lines, compatible with IFC export for open-BIM workflows. These families typically include correct physical dimensions, weight, visual representation configurable by VLT and color, and performance metadata (rated power, U-value, SHGC) that populates automatically in the energy model. Request BIM files at schematic design stage, not at permit submission — incorporating accurate BIPV component data into the BIM model from day one prevents the coordination conflicts discovered during clash detection that generate rework cost. Jia Mao BIPV’s technical documentation resources include product-specific BIM files for commercial project submissions.
13. How can EPCs mitigate risks in BIPV performance guarantees?
Four risk management practices protect EPC firms against guarantee exposure. First, use conservative yield modeling inputs — actual site measurements for irradiance (not satellite data) where possible, and IEA PVPS-recommended loss factors for soiling, thermal mismatch, and wiring resistance. Second, include a degradation buffer in the guarantee calculation — model at 0.6%/year degradation even if the manufacturer warrants 0.5%/year, providing a performance cushion that protects against slightly higher than expected real-world degradation. Third, require independent third-party commissioning that produces the baseline documentation against which any future performance claim is measured. Fourth, include weather normalization language explicitly in the guarantee contract — adjusting the guaranteed threshold up or down based on actual irradiance measured by the on-site sensor relative to the modeled typical meteorological year.
14. What training is available for contractors installing BIPV systems?
NABCEP’s PV Installation Professional certification is the foundational electrical credential. Beyond NABCEP, manufacturer-specific training programs are available from Onyx Solar, Polysolar, Schüco (for integrated curtain wall systems), and Jia Mao BIPV — typically structured as half-day on-site training sessions for first-project crews, covering handling protocols, torque specifications, sealant application, DC electrical safety, and post-installation testing procedures. These programs generally result in a certified installer designation recognized for warranty purposes. For large commercial projects, schedule manufacturer technical representative attendance on-site for the first week of panel installation — the investment prevents the handling errors that generate the most costly warranty claims.
15. How does BIPV impact building energy modeling and LEED certification?
BIPV contributes to LEED v4.1 across multiple credit categories. In Energy & Atmosphere: Optimize Energy Performance, on-site renewable generation reduces the net regulated energy cost, potentially contributing 2–6 points depending on the percentage of baseline energy cost offset (USGBC awards 2 points for 20% offset, scaling to 5 points for 100% offset and a pathway to 6+ points for net zero). BIPV also contributes to Materials & Resources credits through EPD documentation, and to Innovation credits for exceptional performance or innovative strategies. The building’s EUI (Energy Use Intensity) improves directly from BIPV’s contribution to on-site generation — a building generating 30% of its energy on-site from BIPV reduces its net EUI by 30%, significantly improving its ASHRAE 90.1 compliance margin.
Building the Operational Advantage That Compounds Over Time
A BIPV system that is installed correctly but managed poorly is a missed opportunity. A BIPV system that is installed correctly e managed through intelligent monitoring, predictive maintenance, smart load alignment, and professional O&M partnerships is a building asset that compounds in value annually — generating returns that justify the specification decision and validate the client relationship for decades.
The 10 strategies in this guide are not theoretical frameworks. They are operational disciplines that the leading EPC firms, specialized roofing contractors, and curtain wall integrators are building into their service offerings right now — before mass-market BIPV adoption makes these capabilities table stakes rather than competitive differentiators.
Three actions to take before your next BIPV project commissioning:
First, configure string-level monitoring with an independent irradiance sensor and AI-powered alert routing before the commissioning report is issued. The monitoring platform is not a deliverable to set up after handover — it is a commissioning requirement that produces the baseline data every subsequent strategy depends on.
Second, draft a performance-based SLA template that defines system availability targets, fault response times, and annual audit deliverables — and begin using it on your next project. The clients who will pay a premium for professional O&M are the same clients who award the next project.
Third, identify the supply chain relationships that will support your 2026 and 2027 project pipeline. Custom BIPV glass lead times mean procurement decisions made today determine delivery windows next year. Establish the technical relationships — with manufacturers like Jia Mao BIPV, with structural engineers experienced in BIPV assemblies, with third-party commissioning engineers — before you need them urgently.
The BIPV market is at the steep part of its growth curve. The professionals building operational excellence into their BIPV programs today are the ones writing the reference projects, winning the framework agreements, and setting the performance benchmarks that define the market in 2030.
Extended Glossary
AFCI (Arc-Fault Circuit Interrupter): Listed device detecting and interrupting arc fault conditions in DC circuits — required by NEC 690.11 for PV systems above 80V DC.
ASHRAE 90.1: The commercial building energy efficiency standard referenced by IECC and used for LEED energy performance modeling.
BESS (Battery Energy Storage System): Battery bank paired with a BIPV system to store excess generation for peak-hour discharge or resilience backup.
EPC (Engineering, Procurement, and Construction): A project delivery model where one contractor or consortium is responsible for the full project scope from design through commissioning.
EUI (Energy Use Intensity): Annual energy consumption per square foot, used to benchmark building efficiency against ASHRAE baselines for LEED compliance.
IEC 63092-1: The dedicated international BIPV standard covering module requirements for products serving both structural building envelope and PV generation functions.
IV Curve Tracing: Diagnostic test measuring a solar module’s current-voltage characteristic — compared against factory specifications to identify performance defects.
LCOE (Levelized Cost of Energy): The lifetime cost of a generation system divided by its total lifetime energy output — expressed in $/kWh for comparing generation technologies.
NFPA 285: U.S. fire propagation test for exterior wall assemblies — required for commercial buildings over 40 feet; assembly-specific, not component-specific.
POE (Polyolefin Elastomer): Advanced encapsulant film used in premium BIPV glass laminates offering 40% better UV aging resistance than standard EVA, reducing long-term delamination risk.
VLT (Visible Light Transmittance): The fraction of visible daylight passing through glazing. Higher VLT = more daylight, lower power density per m².