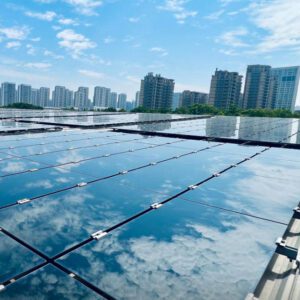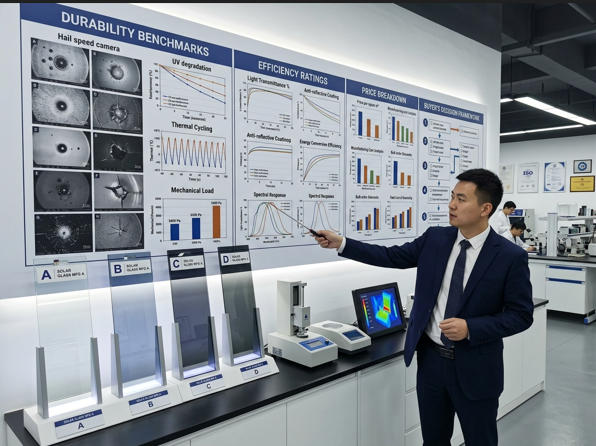
Why the Solar Glass You Specify Changes Everything
A commercial building in Frankfurt replaced its south-facing spandrel panels with solar glass in 2023. The project team chose based on upfront price per square meter. Eighteen months later, output was 23% below the modeled projection — not because of shading or inverter faults, but because the glass supplier’s anti-reflective coating had degraded faster than expected under real-world damp heat conditions.
That kind of outcome is avoidable, but only if buyers understand how to compare solar glass companies properly — not just on price, but across three interlocking pillars: durability, efficiencye total installed price. Get all three right, and a solar glass facade can generate 80–200 kWh per square meter annually while meeting safety, glazing, and fire codes. Prioritize only one, and the project tends to underperform on the others.
This spotlight guide cuts through marketing language to give architects, project developers, and procurement teams the benchmark data, company comparisons, and decision tools they actually need. We cover the science of how solar glass works, how leading manufacturers perform on standardized tests, what drives the gap between a $120/m² and a $380/m² product, and how to structure an RFP that protects you over a 25-year asset life.
What Is Solar Glass and How It Works
Layered Structure and Coatings
Solar glass — also called vidro fotovoltaico or BIPV glazing — is not a single product. It is an engineered assembly that converts a building-envelope material into a power-generating surface. At its core, a solar glass panel stacks these layers from outer surface inward:
- Outer tempered or heat-strengthened glass — provides structural strength, weatherproofing, and the optical entry surface for sunlight.
- Anti-reflective (AR) coating — a nano-porous silica layer etched onto the outer surface. Without AR coating, glass reflects approximately 8–9% of incoming light. With it, reflectance drops below 1%, boosting solar transmittance from ~91% to over 97%.
- Photovoltaic cell layer — monocrystalline silicon cells, thin-film (CdTe or CIGS), or perovskite-based technology embedded in encapsulant (EVA or PVB).
- Inner glass or back-sheet — provides additional structural integrity and, in glass-glass laminates, eliminates moisture ingress that degrades standard back-sheets over time.
- Low-E or selective IR coating (optional) — on the inner glass surface, manages thermal gain and reduces U-factor for energy-code compliance.

A solar glass panel is a multi-layer assembly — each layer affects optical, thermal, electrical, and structural performance simultaneously.
Role in PV Efficiency
The glass layer directly determines how much sunlight reaches the photovoltaic cells. Standard soda-lime float glass transmits roughly 88–90% of visible light, while low-iron solar glass (iron oxide content <0.015%) can reach 91–92% before AR coating. After AR coating, the same glass transmits 97%+. That 6-percentage-point difference, multiplied across a 1,000 m² facade, translates to several thousand additional kilowatt-hours per year.
Beyond raw transmittance, glass also affects operating temperature — and solar cell output falls approximately 0.3–0.5% per °C above 25°C. Ventilated glass assemblies that allow air movement behind the PV layer consistently outperform sealed units in summer peak conditions.
Key Terms Explained
Durability Benchmarks and Testing
Mechanical and Environmental Tests
Solar glass durability is not a qualitative claim — it is a set of pass/fail results on internationally standardized tests. The two dominant certification families are IEC 61215 (design qualification and type approval for terrestrial PV modules) and IEC 61730 (PV module safety). A product that has passed both provides a meaningful baseline. A product that has passed only one, or provides only internal test reports, is a higher procurement risk.
The table below maps the most important tests, what they simulate, and the minimum thresholds that distinguish a performance-grade product from a commodity one.
| Test Name | Standard | What It Simulates | Test Parameters | Pass Threshold | Performance Grade |
|---|---|---|---|---|---|
| Thermal Cycling | IEC 61215-2 MQT 11 | Day-night and seasonal temperature swings | 200 cycles, -40°C to +85°C | <5% power loss; no delamination or cracking | Critical |
| Damp Heat | IEC 61215-2 MQT 13 | Humid tropical or coastal climates | 1,000 hrs at 85°C / 85% RH | <5% power loss; no delamination | Critical |
| Hail Impact | IEC 61215-2 MQT 17 | Hailstorm impact resistance | 25 mm ice balls at 23 m/s (11 impact points) | No cracking, no >5% power loss | Critical |
| Humidity Freeze | IEC 61215-2 MQT 12 | Freeze-thaw cycling in wet climates | 10 cycles, +85°C/85% RH → -40°C | <5% power loss; no visible damage | Critical |
| Mechanical Load | IEC 61215-2 MQT 16 | Wind and snow static pressure | ±2,400 Pa (3 cycles per direction) | <5% power loss; no structural damage | Critical |
| UV Pre-conditioning | IEC 61215-2 MQT 10 | UV-driven encapsulant yellowing and coating degradation | 60 kWh/m² UV dose | <5% power loss; no visible delamination | Important |
| Salt Mist Corrosion | IEC 61701 | Coastal marine exposure | 96–96 hrs salt spray cycles | No corrosion of contacts; <5% power loss | Important for coastal |
| Potential-Induced Degradation | IEC TS 62804-1 | High-voltage system PID sensitivity | 1,000 hrs, 1,500 V DC | <5% power loss | Important for 1,500 V systems |
| Fire Performance (BIPV) | UL 790 / ASTM E108 | Spread of flame across rooftop assemblies | Class A, B, or C rating | Class A for commercial & residential | Mandatory for building envelope |
| Electrical Safety | IEC 61730-2 | Shock, arc, and insulation faults | Dielectric withstand, wet leakage current | No shock hazard; pass wet leakage | Mandatory |
Sources: IEA-PVPS Degradation Report 2025; U.S. DOE Hail Mitigation Guide; NREL IEC 61215 qualification summary.
The IEC 61215 hail test uses 25 mm ice balls — a size that corresponds to moderate hail. Projects in the US Great Plains, northern India, and central Europe face hailstones of 40–70 mm. Specifying modules that have passed an extended hail stress sequence (HSS) — which includes progressively larger impactors — provides measurable protection that the standard test does not. Ask your supplier for HSS results, not just the baseline IEC pass certificate.
Long-Term Performance Expectations
Degradation rate is the annual percentage decline in peak power output. According to NREL’s PV performance database, the median degradation rate across modern crystalline silicon modules is approximately 0.5% per year. Premium manufacturers with glass-glass laminates and high-grade EVA or POE encapsulants consistently achieve 0.25–0.35%/year in long-term field data. That 0.25% difference sounds small — but over 25 years on a 10,000 m² BIPV facade, it represents roughly 200,000+ additional kWh of cumulative generation.
Durability: Weather and Impact Resistance in Detail
Thermal Cycling
Thermal cycling is the most diagnostic single test for solar glass longevity. The IEC 61215 standard requires 200 cycles between -40°C and +85°C. Each cycle stresses every material interface: glass-to-encapsulant, encapsulant-to-cell, cell-to-backsheet or rear-glass, and frame-to-sealant. Failures manifest as microcracks in cells, delamination at the edge seals, solder-joint fatigue, and — specifically for solar glass — coating separation.
Premium dual-glass (glass-glass) laminates consistently outperform glass-backsheet modules in thermal cycling because the matched coefficient of thermal expansion reduces differential stress at the cell layer. Projects in desert climates (Phoenix, Riyadh, Dubai) where daytime-to-nighttime temperature swings regularly exceed 35°C should specifically request suppliers’ 200-cycle results — not the standard 50-cycle baseline.
Hail and Wind Resistance
The IEC 61215 hail test requires no cracking and less than 5% power degradation after 11 impacts of 25 mm ice balls at 23 m/s (approximately 83 km/h). High-performance solar glass products use tempered or heat-strengthened glass at 3.2–4 mm thickness, which typically survives this test with zero visible cracking.
Wind load compliance is governed by static mechanical load tests of ±2,400 Pa — equivalent to roughly 195 km/h wind speed on a facade. For tall-building applications, local wind engineers may require higher design pressures. Always confirm whether the supplier’s test data matches the project’s design-wind pressure, not just the IEC minimum.
Efficiency and Optical Performance
Transmission, Reflectance, and Anti-Reflective Coatings
The optical performance of solar glass is the primary driver of how much electricity a given square meter of facade can produce. The relationship is direct: every 1% increase in glass transmittance translates to roughly 1% more energy output from the PV cells behind it.
Industry test data from the NREL AR coating durability study confirms that anti-reflective coatings provide a 4–7% energy gain over uncoated glass under real-world angular and spectral conditions. The gain is highest during morning and evening hours when sunlight hits the glass at low angles — exactly when uncoated glass reflects the most.

Low-angle morning light — when reflection losses are highest — is where AR-coated solar glass gains a measurable output advantage over uncoated glass.
Note: Power density falls as visible light transmission (VLT) increases — a design trade-off inherent to all current solar glass technologies.
Impact on System Output
The table below illustrates the real-world energy yield difference between a well-specified solar glass assembly and a commodity product on a 500 m² south-facing commercial facade in a mid-latitude location (1,400 peak sun hours/year equivalent):
| Specification Variable | Commodity Glass | Performance Glass | Annual Yield Impact (500 m²) |
|---|---|---|---|
| Glass transmittance (no AR coating) | 91% | 97%+ (AR coated) | +4,200 kWh/yr gain |
| Degradation rate | 0.7%/yr | 0.3%/yr | +25,000 kWh cumulative over 25 yr |
| Operating temperature (sealed vs. ventilated) | +15°C above ambient | +8°C above ambient | +2,100 kWh/yr gain |
| Encapsulant yellowing (EVA vs. POE) | 3–5% after 10 yr | <1% after 10 yr | +3,500 kWh/yr by year 10 |
| Cell mismatch (poor binning) | 2–4% loss | <0.5% loss | +2,800 kWh/yr gain |
Assumptions: 130 W/m² average power density, 1,400 peak sun hours, 80% performance ratio. Calculations for illustrative purposes.
Efficiency Across Different Climates
Low-Angle Sun and Shading Scenarios
Solar glass installed on a vertical facade captures sunlight at lower incidence angles than a roof-tilted panel. In northern latitudes (above 45°N), a south-facing vertical facade receives roughly 60–75% of the annual irradiation of a 30°-tilted roof surface. However, facades capture more diffuse light in winter than a tilted roof and, importantly, they do not require roof space — making them the only viable solar option on many tall or dense urban buildings.
Shading from mullions, adjacent buildings, and roof overhangs affects output disproportionately when panels are wired in conventional string configurations. A row of mullion-shaded cells can suppress the entire string output. Solutions include:
- Module-level power electronics (MLPEs) — microinverters or DC optimizers that independently maximize each panel’s output regardless of adjacent shading.
- Half-cut cell technology — cells split horizontally so shading affects only half the cell’s current, reducing mismatch losses.
- Bypass diodes — standard in most modules, but their configuration matters for facade-specific shading patterns.
Temperature Effects
Temperature effects on solar glass are more complex than for standard rooftop modules because the glass is part of a building envelope. In hot climates, dark solar glass on a south- or west-facing facade can reach surface temperatures of 70–80°C on summer afternoons, significantly above the 25°C STC rating point. A module with a temperature coefficient of -0.35%/°C at 70°C operates at approximately 84% of rated output due to temperature alone.
Conversely, in cold-climate cities like Oslo, Helsinki, or Calgary, the same solar glass benefits from lower operating temperatures in winter — and vertical facades in these cities often have winter irradiation capture ratios more favorable than in mid-latitude locations.
Price Factors and Market Dynamics
Material Costs and Manufacturing
Solar glass pricing reflects a stack of material and process costs that vary significantly by supplier origin, product type, and order volume. The key cost drivers are:
Sources: Market Growth Reports BIPV 2024; Metsolar BIPV cost analysis.
Installation and Lifecycle Costs
The glass laminate itself typically represents 35–42% of total installed cost. The framing and mounting system adds 20–25%, and it is an area where specifying aluminum with thermal breaks (instead of standard aluminum) can increase upfront cost by 8–12% while saving significantly on building heat loss — and preventing condensation-related glass failures.
Lifecycle cost modeling should add annual O&M costs of 0.5–1.5% of installed cost per year, including cleaning ($1.5–$4.50/m²/yr), monitoring ($0.8–$2.0/m²/yr), inverter replacement (typically year 10–15), and periodic glass inspection. Over 25 years, O&M can represent 15–35% of total lifecycle cost — which is why durability-driven upfront spec decisions have outsized financial impact.
Price: Value Comparison Across Leading Brands
Cost-Per-Watt Metrics and Installed Price Ranges
Warranty and Service Considerations
Warranty terms for solar glass typically combine a product workmanship warranty (10–15 years) and a linear power output warranty (25 years, guaranteeing ≥80% of rated output at year 25). But the power warranty is only as useful as the company’s ability to honor it. For procurement teams, the right question is not just “what does the warranty say?” but “what is the supplier’s financial standing, local presence, and documented warranty-claim process?”
| Warranty Dimension | Minimum Acceptable | Best Practice Standard | Red Flags |
|---|---|---|---|
| Product workmanship | 10 years | 12–15 years | Less than 5 years; exclusions for delamination |
| Linear power output | ≥80% at year 25 | ≥85% at year 25, ≥90% at year 10 | Step-style warranty (cliff at year 10); no year-by-year table |
| Coating durability | 5 years on AR coating | 10 years with transmittance retention data | No coating warranty; AR coating not included in power warranty |
| Glass breakage coverage | Product defect only | Includes manufacturing defects and seal failures | Any breakage excluded regardless of cause |
| Color / appearance | Not always required | Required for visible BIPV facades: ΔE <3 over 25 yr | No appearance warranty; only power covered |
| Service response SLA | 30-day response to claims | 10-business-day response; local authorized service partners | No SLA defined; claim resolution through overseas HQ only |
BIPV Solar Glass in Action: Understanding Building-Integrated Photovoltaics
The following video provides a clear visual overview of how BIPV solar glass integrates into building facades and what makes it different from conventional rooftop solar installations — an excellent reference point before approaching suppliers with technical questions.
Case Studies: Representative Solar Glass Projects
Brand A vs. Brand B: A Procurement Team’s Real Comparison
In 2023, a European commercial developer evaluated two solar glass suppliers for a 1,800 m² south-facing curtain-wall specification on a 12-story mixed-use building in Lisbon, Portugal. Both products were semi-transparent (35% VLT), with similar power density claims of approximately 100 W/m².
| Evaluation Criterion | Supplier A (European brand) | Supplier B (Chinese manufacturer) | Decision Weight |
|---|---|---|---|
| Verified power density (third-party lab) | 97 W/m² | 91 W/m² | Alta |
| IEC 61215 + 61730 certificates | Both confirmed | IEC 61215 only | Alta |
| Damp heat test result (1,000 hr) | 2.1% power loss | 4.8% power loss | High (Lisbon coastal climate) |
| Price per m² (glass only, FOB) | €198/m² | €134/m² | Medium |
| Installed cost incl. framing (delivered) | €312/m² | €268/m² | Medium |
| 25-yr modeled energy yield (kWh/m²/yr) | 112 kWh/m²/yr | 98 kWh/m²/yr | Alta |
| 25-yr NPV of energy savings (1,800 m²) | €394,000 | €311,000 | Decisive |
| Warranty (workmanship / power) | 12 yr / 25 yr linear | 5 yr / 25 yr step | Medium-high |
Despite Supplier B’s €44/m² lower installed cost, the procurement team selected Supplier A. The 25-year NPV difference of €83,000 — driven by better damp heat performance and higher modeled yield — exceeded the upfront cost savings by 89%. The decisive factor was the coastal climate: Lisbon’s Atlantic-facing facades experience higher damp heat exposure than inland European locations, making the damp-heat test result a project-specific risk driver.
Real-World Performance Insights
According to a comprehensive BIPV facade case study published in MDPI Energies (2025), a full-size commercial BIPV facade in central Europe generated approximately 65–85 kWh/m²/year on a predominantly south-facing glass curtain wall. The study noted that actual output was 12–18% below initial projections primarily due to:
- Shading from rooftop HVAC equipment (8–10% annual loss).
- Inverter undersizing in the original electrical design (4–5% loss).
- Soiling accumulation between the two annual cleaning cycles (3–5% seasonal loss).
None of these were glass-quality issues. They were design, engineering, and maintenance decisions. This is the core industry insight that separates experienced BIPV buyers from first-time specifiers: the glass quality floor matters, but the design quality ceiling matters more.

Real-world BIPV facade projects consistently show that design quality — shading analysis, inverter sizing, cleaning access — determines output as much as the glass specification itself.
Buying Guide and Decision Framework
How to Evaluate Durability, Efficiency, and Price
The three pillars — durability, efficiency, and price — are interdependent. A product that scores well on all three is the target, but the right weighting depends on project context. Use the matrix below to understand which pillar should dominate your evaluation based on project characteristics:
| Project Characteristic | Primary Evaluation Pillar | Key Test / Metric to Request | Minimum Acceptable Benchmark |
|---|---|---|---|
| Coastal / high-humidity location | Durabilidade | IEC 61701 salt mist; damp heat 1,000 hr result | <3% power loss after damp heat |
| Hail-prone region (US Plains, central EU) | Durabilidade | Extended hail stress sequence (HSS) beyond IEC 61215 MQT17 | Zero cracks at 35+ mm ice ball test |
| High-rise facade / tall building | Durabilidade | Mechanical load test result; fire classification | ±4,000 Pa; Class A fire rating |
| Energy performance / ESG targets | Eficiência | Third-party verified power density; degradation rate | ≥130 W/m² (opaque); ≤0.4%/yr degradation |
| Daylighting / occupant comfort | Eficiência | VLT, SHGC, color rendering index (CRI) | VLT ≥40% for vision zones; CRI ≥80 |
| Budget-constrained project | Price | Total installed cost incl. framing; O&M assumptions | Lifecycle NPV model over 25 yr |
| Heritage / HOA / planning-sensitive | Efficiency + Aesthetics | Color rendering, glare analysis, facade visual mockup | ΔE <3 color shift; approved glare report |
RFP / Selection Checklist
Use this checklist when issuing a request for proposals to solar glass suppliers. Every item should have a documented, verifiable answer — not a sales claim.
- Provide third-party lab reports for IEC 61215 and IEC 61730 (not just certificate numbers — request the actual test summary pages).
- Submit glass build-up specification: glass type, thickness, iron content, encapsulant type, interlayer material, and edge-seal system.
- Provide AR coating method (sol-gel, CVD, or sputtered), retention data after UV pre-conditioning, and damp heat test.
- Provide power density (W/m²) at Standard Test Conditions and the measured degradation rate from field installations (at least 500 kW reference system, minimum 3 years of monitoring data).
- Confirm fire classification (UL 790 Class A or equivalent EN standard) with test report, not just claim.
- Detail the linear power output warranty: provide the year-by-year power floor table, financial guarantor, and claim response SLA.
- Confirm replacement panel availability: are current cell types committed for at least 15 years, or is color/cell-type matching guaranteed?
- Provide a completed project reference list with contact details for at least two facade or skylight installations of comparable scale.
- Identify local authorized service partners in the project’s country/region.
- Submit SHGC, U-factor, VLT, and weight data in a format compatible with the project’s building energy model software (EnergyPlus, IDA ICE, etc.).
The single most underused tool in solar glass procurement is the independent performance audit. For projects over $500,000 in glass value, commissioning an independent PV engineer to review supplier test data and model actual yield against supplier claims typically costs $8,000–$15,000 and consistently identifies 10–25% yield discrepancies between marketing figures and realistic projections. The cost is recovered in the first year of operation.
Solar PV Glass Market: Size, Growth, and What Buyers Need to Know
The global solar photovoltaic glass market was valued at approximately $20.3 billion in 2025 and is projected to reach $80.4 billion by 2034, growing at a CAGR of approximately 16% (source: IMARC Group Solar PV Glass Market Report). Volume terms tell an even sharper story: from 32.1 million tons in 2025 to 74.8 million tons by 2030 according to Research and Markets.
For buyers, this growth rate has two contradictory implications. On the positive side, increasing manufacturing scale is continuously driving down glass-laminate prices — particularly for Chinese-origin products from Xinyi Solar, Flat Glass Group, and manufacturers like Jia Mao Bipv, whose 3 GW production capacity positions them well for volume pricing. On the risk side, rapid market growth also attracts new entrants with limited field track records. A supplier that was founded in 2022 cannot provide 10-year field degradation data — which is why the procurement checklist above emphasizes verifiable reference installations.

The solar PV glass market is growing at ~16% CAGR — but scale alone doesn’t equal quality. Buyers who embed IEC test requirements in RFPs consistently outperform those who rely on price as the primary filter.
Recap: Key Takeaways for Solar Glass Buyers
Solar glass is a mature product category with significant performance variance between suppliers. The gap between the best and worst products on durability, efficiency, and real-world energy yield is large enough to define whether a project reaches its financial targets.
The three pillars framework is a practical starting structure:
- Durability: Require IEC 61215 + IEC 61730 certificates with actual test result pages. Prioritize damp heat and thermal cycling results for your specific climate. Use the extended hail stress sequence for hail-prone locations.
- Efficiency: Compare third-party-verified power density and degradation rates — not nameplate claims. Model annual kWh/m² for your specific orientation and climate, not STC watts.
- Price: Evaluate total lifecycle cost, not installed cost per m². A product that is $60/m² cheaper upfront but degrades 0.4%/yr faster costs more over 25 years on most commercial projects.
Practical Steps for Buyers Comparing Offerings
- Download the full IEC 61215 and IEC 61730 test summary pages (not just the certificate) from each shortlisted supplier before issuing final pricing requests.
- Use the NREL PVWatts Calculator to model annual yield for your specific facade orientation, tilt, and location before finalizing the spec.
- Request field monitoring data from at least one completed project of comparable scale — and contact the reference directly to confirm actual vs. projected yield.
- Model O&M costs for 25 years including cleaning, inverter replacement, and monitoring before signing a supply agreement.
- For BIPV facade and skylight products, check the glass-integrated solar panel facade review guide and review the full product range from multiple certified suppliers including both European and Asian manufacturers before shortlisting.
- Confirm that all products being compared use low-iron glass with an AR coating — not standard float glass — as this single specification point is the most common source of yield underperformance in budget-tier procurement.