
The global solar PV glass market reached $22.05 billion in 2026 and is projected to hit $93.72 billion by 2034, according to Fortune Business Insights. Behind those numbers are millions of purchasing decisions — and each one carries a question that determines whether a glass solar panel becomes a 25-year revenue-generating asset or a 25-year liability: what exactly am I covered for when something goes wrong?
Warranties, certifications, and maintenance plans are the three pillars that separate informed solar buyers from those who discover gaps in their coverage only after a hailstorm, a sudden performance drop, or a manufacturer bankruptcy. Yet these topics receive a fraction of the attention given to cell efficiency or price per watt — despite having a far greater impact on lifetime return on investment.
This guide walks through every dimension a buyer needs to evaluate before signing a purchase order for glass solar panels. It covers the structural differences that make glass panels unique, the two warranty types every buyer must understand, the international certifications that signal genuine quality versus marketing, glass type selection and its effect on longevity, real-world degradation data, installation variables, cleaning and maintenance protocols, monitoring system options, insurance considerations, and the financial framework for calculating true total cost of ownership. Each section draws on field data, third-party testing standards, and documented case outcomes — not manufacturer marketing copy.
Understanding Glass Solar Panels: An Overview
What Makes Glass Panels Different from Other Designs
Traditional solar panels use a glass-backsheet construction: a tempered glass front layer protects the cells, while a polymer backsheet (typically a fluoropolymer or polyester composite) seals the rear. Glass-glass panels replace that polymer backsheet with a second layer of tempered glass, creating a symmetrical sandwich structure that fundamentally changes the panel’s mechanical and environmental performance profile.
The difference is not cosmetic. A study published in the Oxford Academic Clean Energy journal found that double-glass bifacial modules in hot-arid climates maintained a performance ratio of 91%, compared with 81% for single-glass polycrystalline panels tested under identical conditions. The primary driver was degradation: glass-glass modules degraded at 0.3–0.4% per year versus 0.5–0.7% per year for glass-backsheet modules. Over 25 years, that difference compounds into a 5–8% gap in cumulative energy production — worth $3,000–$8,000 on a typical 10 kW residential system.
The second glass layer acts as a superior moisture barrier. Polymer backsheets allow water vapor permeation at rates of 1–4 g/m²/day depending on material quality and temperature. Glass is essentially impermeable. This blocks the moisture ingress pathway that triggers Potential Induced Degradation (PID), delamination, and corrosion of cell interconnects — three of the leading causes of premature panel failure in the field.
Manufacturers like Jia Mao Bipv have pushed this architecture further by pairing double-glass construction with imported POE (Polyolefin Elastomer) encapsulant films instead of standard EVA. POE improves UV aging resistance by approximately 40% compared with EVA and resists acetic acid formation — the chemical process that causes the yellowing and snail trails visible on aging panels. Their modules carry a 25-year performance warranty backed by monocrystalline N-type cells operating above 22% cell efficiency.
Key Components of a Glass Solar Panel
A glass solar panel is an engineered assembly of six primary components, and the quality of each determines the system’s field life. The front glass — typically 3.2 mm low-iron tempered glass with 91–92% light transmittance — serves as the first optical layer and primary weather barrier. The encapsulant (EVA or POE) bonds the cells to the glass and provides electrical insulation. The solar cells (monocrystalline or polycrystalline silicon, or thin-film) convert photons to electricity. The rear glass (in glass-glass designs) or backsheet seals the module. The junction box houses bypass diodes and connection terminals. And the aluminum frame provides structural rigidity and mounting compatibility.
Each component has its own failure mode and expected service life, which is why sophisticated buyers evaluate panels at the component level — not just by wattage and price. A panel with high-efficiency cells but a low-quality encapsulant will develop yellowing and delamination within 8–12 years, dragging the effective system output below its warranted threshold long before year 25.
Warranties and What They Cover
Product Warranty vs. Performance Warranty
Every glass solar panel ships with two distinct warranties, and confusing them is one of the most costly mistakes a buyer can make.
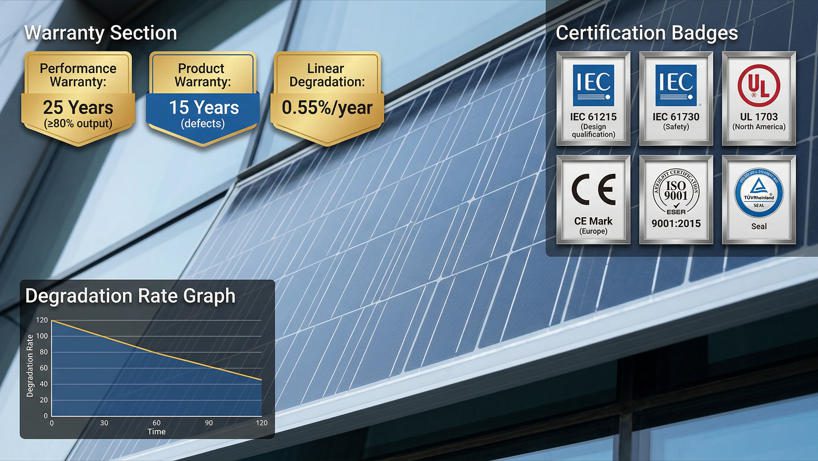
The product warranty (also called the materials or workmanship warranty) covers manufacturing defects — cracked glass, faulty junction boxes, delamination, defective bypass diodes, and premature corrosion. If the panel fails due to a defect in materials or workmanship, the manufacturer will repair or replace it at no cost during the product warranty period. According to EnergySage, most manufacturers guarantee product warranties of 10–12 years as a minimum, with premium brands extending coverage to 25 years.
The performance warranty guarantees that the panel will produce a specified percentage of its rated power output over time. The industry standard is a two-step guarantee: at least 90% of rated output after 10 years and at least 80–85% after 25 years. If independent testing confirms that a panel has degraded below its warranted output curve, the manufacturer is obligated to supplement the underperforming panels or provide financial compensation.
The critical distinction: the product warranty protects against catastrophic failure (the panel breaks), while the performance warranty protects against gradual degradation (the panel slowly loses output). A panel that physically functions but produces only 70% of its rated power at year 15 is not a product warranty claim — it is a performance warranty claim, and the resolution process is different.
Product vs. Performance Warranty Comparison
| Feature | Product Warranty | Performance Warranty |
|---|---|---|
| What It Covers | Manufacturing defects, material failure, workmanship errors | Guaranteed minimum power output over time |
| Typical Duration | 10–25 years | 25–30 years |
| Standard Guarantee | Free repair or replacement | ≥90% output at Year 10; ≥80–85% at Year 25 |
| Claim Trigger | Physical defect (cracked glass, delamination, corroded connectors) | Measured output drops below warranted threshold |
| Proof Required | Visual inspection, documentation of defect | Independent performance testing (IV curve, thermal imaging) |
| Premium Brand Example | 25-year product warranty (REC, Maxeon, Jia Mao Bipv) | 92% at Year 25 (Maxeon); 87.4% at Year 30 (REC) |
Typical Durations and Claim Processes
Filing a warranty claim is rarely as simple as calling a phone number. The process typically requires the original purchase receipt, proof of professional installation, photographs documenting the defect, and — for performance claims — an independent electrical performance test (IV curve trace) conducted by a certified technician. Some manufacturers also require that the claimant demonstrate compliance with their installation guidelines; improper mounting, wiring, or grounding can void coverage entirely.
A SolarReviews analysis of warranty claim experiences found that processing times range from 2 weeks to 6 months depending on the manufacturer’s service infrastructure. Manufacturers with local distribution centers and certified installer networks (such as REC’s ProTrust program) resolve claims significantly faster than brands that require shipments to overseas facilities.
One practical consideration that few buyers evaluate upfront: what happens if the manufacturer goes out of business? Solar panel manufacturers have a historically high failure rate — dozens of brands have exited the market over the past decade. A 25-year warranty from a company that ceases operations in year 8 is worthless. This is why manufacturer financial stability, bankability assessments (such as those published by Bloomberg New Energy Finance’s Tier-1 list), and third-party warranty insurance products deserve serious attention during the purchasing process.
Important Exclusions and Limitations
Every warranty contains exclusions, and the most damaging are the ones buyers discover only after filing a claim. Common exclusions include damage from “acts of God” (hail, hurricanes, lightning), improper installation by non-certified contractors, modification of the panel or system after installation, exposure to corrosive chemicals or salt spray beyond specified limits, and failure to follow the manufacturer’s maintenance guidelines.
The maintenance exclusion is particularly significant. Many performance warranties require the owner to clean panels at minimum intervals and maintain monitoring records. Failure to document routine maintenance can give the manufacturer grounds to deny a performance claim — even if the degradation was caused by an internal defect unrelated to soiling.
Certifications to Look For
International Standards (IEC, UL, CE)
Certifications are the objective, third-party validation that a panel meets specific safety and performance thresholds. Without them, a buyer has only the manufacturer’s word — which, in an industry with hundreds of competing brands and wide quality variation, is insufficient.
Three certification frameworks dominate the global solar market. IEC (International Electrotechnical Commission) standards are recognized worldwide and form the baseline for panel qualification. UL (Underwriters Laboratories) standards are mandatory for panels sold in the United States and Canada. CE (Conformité Européenne) marking is required for panels sold in the European Economic Area.
The two IEC standards every buyer must verify are IEC 61215 and IEC 61730. IEC 61215 is the design qualification and type approval standard — it subjects panels to thermal cycling (200 cycles between -40°C and +85°C), damp heat exposure (1,000 hours at 85°C and 85% relative humidity), mechanical load testing (5,400 Pa front and 2,400 Pa rear), and the hail impact test (25 mm ice balls fired at 23 m/s onto 11 points). IEC 61730 is the safety qualification standard — it tests for electrical shock hazards, fire resistance, and mechanical integrity under fault conditions.
In the United States, UL 1703 (now transitioning to UL 61730) is the mandatory safety standard for PV modules. It covers the same ground as IEC 61730 but adds specific requirements for the U.S. electrical code, including ground fault protection and rapid shutdown compliance per NEC Article 690. For BIPV applications, UL 7103 is the dedicated standard that covers electrical safety, fire classification, wind resistance, weathering, and impact testing for panels that serve as building materials.

Safety and Fire Ratings
Fire safety is a non-negotiable dimension of panel selection, especially for rooftop installations where a panel fire can endanger the entire building. In the United States, solar panels receive fire classifications of Class A, B, or C under UL 790 / ASTM E-108 testing. Class A provides the highest level of fire resistance — the panel must resist severe fire exposure without flame spread exceeding 1.82 meters and without burning debris falling from the assembly. Class C represents the minimum acceptable standard.
Building codes in many jurisdictions — including all of California and other wildland-urban interface (WUI) zones — require Class A-rated roofing assemblies. A panel that only carries Class C rating cannot legally be installed on a Class A roof without supplementary fire protection measures. This is a detail that some discount panel suppliers omit from their marketing, and it can result in failed inspections, costly rework, or voided building insurance.
The Jia Mao Bipv laminated glass module line meets B1-grade flame retardancy — the highest classification for building materials under Chinese standard GB 8624 — and is designed for integration into curtain walls and facades where fire resistance is critical for occupant safety.
Certification Marks and What They Mean
A panel may display multiple certification marks, and understanding what each one actually validates prevents buyers from being misled by logos that look impressive but cover narrow scope. The TÜV Rheinland mark indicates that the panel has been tested and certified by one of the world’s most rigorous independent testing bodies — it is widely considered the gold standard. The CE mark confirms compliance with EU safety directives but is a self-declaration by the manufacturer, not independent lab certification. The MCS (Microgeneration Certification Scheme) mark is required for panels installed under UK government incentive programs. And ISO 9001 certification covers the manufacturer’s quality management system — it says nothing about the product itself, only about the consistency of the manufacturing process.
The buyer’s checklist should verify, at minimum, IEC 61215 + IEC 61730 (or UL 61730 for U.S. installations), fire classification appropriate for the installation jurisdiction, and an independent test report from a recognized lab (TÜV Rheinland, TÜV SÜD, Intertek, UL, or CSA). Request the actual test certificate number — not just the logo on the datasheet.
Glass Types and Their Impact on Longevity
Tempered vs. Laminated Glass
The front glass on a solar panel is almost always tempered — a heat treatment process that increases mechanical strength by 4–5x compared with annealed glass. When tempered glass breaks, it fractures into small, relatively harmless granules rather than sharp shards. This is essential for safety (especially on rooftops where maintenance workers operate) and for IEC 61215 hail-impact compliance.
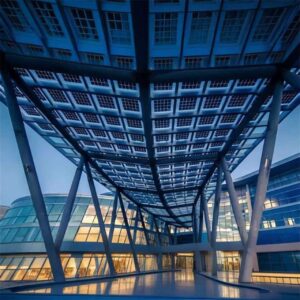
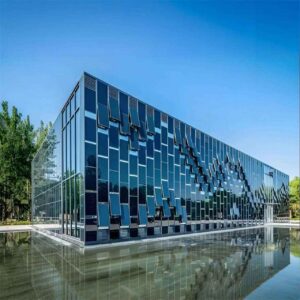
Laminated glass bonds two or more glass layers with an interlayer — typically polyvinyl butyral (PVB) or SentryGlas Plus (SGP). When laminated glass breaks, the interlayer holds the fragments together, maintaining the panel’s structural integrity even after impact. This makes laminated glass the preferred choice for BIPV applications (overhead skylights, canopies, facades) where falling glass debris poses a safety hazard and for hurricane-prone regions where large-missile impact resistance is mandated by local building codes.
A detailed comparison from Jia Mao Bipv’s solar glass analysis documents how their solar glass is strengthened through tempering to handle bad weather and strong winds, with lab-tested wind pressure resistance of 4.0 kPa — exceeding the requirements for architectural curtain wall standards. Their BIPV laminated glass modules carry a 25-year structural integrity warranty covering complete laminate adhesion and impact resistance.
Anti-Reflective and Other Coatings
Even premium low-iron glass reflects approximately 4% of incident light per surface — roughly 8% total across both surfaces. Anti-reflective (AR) coatings, typically a porous silica sol-gel layer applied before tempering, reduce combined surface reflection to under 2%, boosting effective transmittance above 96%. A 2023 study published in Solar Energy (cited 154 times) confirmed that typical porous SiO₂ AR coatings reduce reflection by 2–3%, while field testing by SunPower/Iris Hellas measured sustained real-world energy gains of 3.5–5% over three years.
Self-cleaning coatings represent the second major coating category. Hydrophilic coatings (TiO₂-based) use photocatalytic reactions triggered by UV light to decompose organic contaminants; rainwater then sheets across the surface and carries debris away. Jia Mao Bipv’s ultra-clear tempered glass integrates a proprietary self-cleaning surface coating that reduces maintenance costs by 30% — a meaningful saving for commercial rooftop arrays where professional cleaning services typically cost $0.03–$0.05 per watt per visit.
Impact on Durability and Integration with Framing
Glass type directly affects how the panel integrates with its aluminum frame and mounting system. Tempered glass has a different thermal expansion coefficient than laminated glass, and the frame-to-glass seal must accommodate these differences over 25+ years of thermal cycling (-40°C to +85°C). Poor seal design leads to moisture ingress, which accelerates PID and corrosion.
Quality manufacturers use structural adhesive strips rated for 25-year adhesion, integrated drainage channels to prevent water pooling at the frame-glass interface, and matched thermal expansion coefficients between the glass, encapsulant, and frame. Hot-melt connection technology — used in Jia Mao Bipv’s frame sealing system — eliminates the micro-gaps that traditional gasket-based seals develop over time, reducing the risk of hidden seepage that only manifests as electrical performance loss years after installation.
Performance and Degradation Rates
Typical 25-Year Degradation Profiles
All solar panels degrade over time — the question is how fast and how predictably. An NREL meta-analysis of degradation data spanning thousands of systems found that the median degradation rate across all crystalline silicon technologies is approximately 0.5–0.7% per year, with 78% of all reported data falling below 1%/year. Premium manufacturers with N-type cell technologies (TOPCon, HJT) report rates as low as 0.25% per year.
The degradation profile is not linear. Most panels experience a higher initial degradation — typically 1–3% in the first year — as the cells undergo Light-Induced Degradation (LID) or, in the case of N-type cells, Light and Elevated Temperature Induced Degradation (LeTID). After this initial drop, degradation stabilizes to a steady-state rate for the remainder of the panel’s life.
25-Year Power Output by Panel Technology (Starting at 400W)
Year 1 Output (after initial LID)
Premium N-type (Glass-Glass)
Standard Mono PERC (Glass-BS)
Budget Poly (Glass-BS)
Year 10 Output
Premium N-type (Glass-Glass)
Standard Mono PERC (Glass-BS)
Budget Poly (Glass-BS)
Year 25 Output
Premium N-type (Glass-Glass)
Standard Mono PERC (Glass-BS)
Budget Poly (Glass-BS)
Data sources: NREL Degradation Study, EnergySage warranty analysis, manufacturer datasheets. Premium N-type assumes 0.25%/yr steady-state degradation with 1% first-year LID. Standard Mono PERC assumes 0.5%/yr with 3% first-year LID. Budget Poly assumes 0.7%/yr with 5% first-year LID.
The gap between premium glass-glass N-type panels and budget polycrystalline glass-backsheet panels widens dramatically over time. At year 25, the premium panel retains 93.2% of its original output (373W out of 400W), while the budget panel retains only 74.0% (296W). On a 10 kW system, that is a difference of 770W of capacity — producing roughly 1,150 additional kWh per year in a location with 1,500 peak sun hours.
Temperature Coefficient Considerations
The temperature coefficient measures how much a panel’s output decreases for every degree Celsius above the Standard Test Condition (STC) reference temperature of 25°C. Most crystalline silicon panels have a temperature coefficient between -0.30% and -0.45% per °C. At a roof surface temperature of 65°C (common on dark rooftops in summer), a panel with a -0.35%/°C coefficient loses approximately 14% of its rated output.
Glass-glass panels have a slight thermal advantage: the rear glass radiates heat more effectively than a dark polymer backsheet, reducing cell operating temperature by 2–5°C under identical conditions. On a panel rated at 400W with a temperature coefficient of -0.34%/°C, that 3°C reduction preserves approximately 4W of output — a small but persistent advantage that compounds over 25 years of summer operation.
Jia Mao Bipv addresses this through low-temperature coefficient materials in their cell integration process, specifically designed to ensure stable performance in high-temperature environments. Their BIPV facade modules, which are mounted vertically and receive natural air circulation on both sides, operate at substantially lower temperatures than flush-mounted rooftop panels — a structural advantage that translates directly into higher annual energy yield per rated watt.
Real-World Factors That Affect Performance
Laboratory test conditions (1,000 W/m² irradiance, 25°C cell temperature, AM1.5 spectrum) do not exist in the field. Real-world performance is shaped by soiling (dust, pollen, bird droppings), shading (trees, adjacent buildings, antenna equipment), module mismatch, wiring losses, inverter efficiency, and grid curtailment. A well-designed system in a favorable location typically achieves a performance ratio (PR) of 75–85%, meaning it produces 75–85% of its theoretical maximum energy output.
Soiling alone can reduce output by 5–25% depending on location and cleaning frequency, according to a 2022 NIH meta-analysis. In desert regions (Middle East, North Africa, southwestern U.S.), soiling losses regularly exceed 15% within weeks of cleaning. Coastal installations face salt spray deposition, which creates opaque residue that is harder to remove than dry dust. Snow cover eliminates output entirely until cleared, though steep-tilt installations shed snow faster than low-angle arrays.
Installation Considerations and System Matching
Mounting Options and Wind/Snow Loads
A glass solar panel is only as reliable as the mounting system that holds it in place. The ASCE 7-16 standard governs structural load calculations for solar installations in the United States, specifying wind uplift, snow load, and seismic requirements by geographic zone. In hurricane-prone regions (Florida, Gulf Coast), panels must withstand wind speeds exceeding 150 mph — requiring through-bolted mounting clamps and reinforced rail systems rather than standard clips.
Most residential solar panels can handle snow loads of 50–75 pounds per square foot (psf), with commercial-grade panels engineered for higher loads in regions where ground snow loads exceed 40 psf. The mounting system must distribute these loads evenly across the roof structure; concentrated point loads can crack roof decking or deflect rafters, leading to water intrusion and structural damage unrelated to the solar equipment itself.
Glass-glass panels are approximately 3–6 kg heavier per panel than glass-backsheet equivalents. On older buildings or structures near their load-bearing limits, this weight difference requires a structural engineering assessment before installation. The Jia Mao Bipv industrial and commercial roof PV panel line addresses this with Grade-14 wind resistance and a no-roof-penetration mounting design — eliminating the roof warranty complications that arise when traditional lag-bolt mounting systems puncture the waterproof membrane.
Inverter and Panel Compatibility
Pairing the wrong inverter with a panel string can void warranties and reduce energy harvest. The inverter’s maximum input voltage must exceed the panel string’s open-circuit voltage (Voc) at the lowest expected operating temperature — because Voc increases as temperature drops. Exceeding the inverter’s voltage limit can damage the equipment and void both the inverter and panel warranties.
String sizing calculators (available from major inverter manufacturers like SolarEdge, Enphase, and Huawei) automate this process, but buyers should verify the calculations independently — especially for installations in extreme climates where temperature swings exceed the range used in standard calculator presets.
Wiring, Bypass Diodes, and System Topology
Bypass diodes inside each panel’s junction box prevent hot spots caused by shading or cell mismatch. When one cell in a string is shaded, the bypass diode routes current around it — protecting the shaded cell from reverse-bias heating that can cause permanent damage. Most modern panels include 3 bypass diodes, dividing the cell string into three segments. Panels with higher bypass diode counts provide finer shading tolerance, which matters for installations with partial shading from nearby objects.
System wiring topology (series vs. parallel stringing) affects both performance under partial shading and the type of monitoring available. Series-strung systems are simpler and cheaper but lose proportionally more output when a single panel is shaded. Parallel configurations and module-level power electronics (microinverters or DC optimizers) isolate the impact of shading to the individual affected panel — a critical advantage for rooftops with chimneys, dormers, or nearby trees.
Long-Term Maintenance and Cleaning Practices

Cleaning Frequency, Methods, and Safety
The consensus among industry experts and field data is that glass solar panels should be cleaned at minimum twice per year under standard conditions. However, site-specific factors may require quarterly or even monthly cleaning. Panels located near busy roads or construction sites accumulate particulate matter faster. Agricultural installations collect pollen, pesticide drift, and dust from tillage. Coastal installations need more frequent cleaning to remove salt deposits that standard rainfall does not dissolve.
The recommended cleaning method is simple: deionized or softened water applied with a soft-bristle brush or squeegee, ideally in early morning or late afternoon when the panel surface is cool. Using hard tap water leaves mineral deposits that bake onto the glass under sunlight, creating a permanent haze that reduces transmittance. Abrasive pads, high-pressure washers, and chemical detergents can damage AR coatings and void the manufacturer’s warranty. Never walk on panels — even glass-glass panels — as micro-cracks from foot traffic may not be visible but reduce output and accelerate degradation.
Safety is paramount. Rooftop cleaning involves fall hazards, electrical shock risk (panels generate voltage whenever exposed to light), and slippery wet surfaces. The Occupational Safety and Health Administration (OSHA) requires fall protection for any work at heights exceeding 6 feet. For residential systems, many owners choose professional cleaning services at $150–$350 per visit — a cost that pays for itself through the output recovered from clean glass surfaces.
Detecting Microcracks and Coating Wear
Microcracks in solar cells are invisible to the naked eye but can reduce a panel’s output by 2–10% depending on severity and location. They typically result from mechanical stress during transportation, installation, or thermal cycling. Over time, microcracks expand and disconnect cell fragments from the electrical circuit, creating inactive zones that show up as dark patches in electroluminescence (EL) imaging.
EL testing works by applying a forward-bias current to the panel in darkness — functioning cells glow uniformly under an infrared camera, while cracked or damaged cells appear dark. This technique can detect micro-cracks, broken interconnect ribbons, PID damage, and encapsulant delamination at a resolution that no visual inspection or electrical measurement can match. Professional EL imaging services cost $50–$200 per panel and are recommended at installation (to establish a baseline), at year 5, and whenever monitoring data shows unexplained performance drops.
Coating wear is harder to detect visually but manifests as gradually declining output that exceeds the panel’s warranted degradation rate. If monitoring data shows a panel degrading at 1.2%/year when the warranted rate is 0.5%/year, and soiling has been ruled out through cleaning, AR coating degradation is a likely cause — especially in harsh desert or coastal environments where lower-quality coatings deteriorate within 5–7 years.
Preventive Maintenance Schedule
| Task | Frequency | Estimated Cost (Residential 10 kW) | Notes |
|---|---|---|---|
| Visual inspection | Quarterly | Free (DIY from ground) | Check for visible damage, debris, bird nests, shading changes |
| Panel cleaning | 2–4x per year | $150–$350 per visit (professional) | Soft water + soft brush; no chemicals; cool panels only |
| Monitoring data review | Monthly | Free (included with monitoring system) | Flag panels producing <90% of string average |
| Electrical inspection | Annually | $200–$500 | Check connections, grounding, cable condition, junction boxes |
| Thermal imaging scan | Every 2–3 years | $300–$600 | Identifies hot spots from cell defects or connection failures |
| EL imaging (baseline + periodic) | At install, Year 5, and on suspicion | $50–$200 per panel | Detects micro-cracks invisible to other methods |
| Inverter firmware update | As released by manufacturer | Free (remote update) | Improves MPPT algorithms and grid compliance |
| Mounting hardware torque check | Every 3–5 years | $100–$300 (part of general inspection) | Thermal cycling loosens bolts over time |
Monitoring and Diagnostics for Glass Panels
Monitoring Options (String vs. Microinverters vs. DC Optimizers)
The monitoring architecture of a solar system determines how quickly — and how precisely — you can detect performance problems. Three primary architectures dominate the market, each with different monitoring granularity, cost, and maintenance implications.
String inverters (SMA, Fronius, Huawei) monitor at the string level, showing total output for each group of series-connected panels. This is the lowest-cost option ($0.08–$0.15/W) but provides no visibility into individual panel performance. If one panel in a 12-panel string develops a fault, the monitoring system shows reduced string output, but the owner cannot determine which panel is responsible without physical inspection.
DC power optimizers (SolarEdge, Tigo) attach to each panel and perform maximum power point tracking (MPPT) at the module level before feeding a central inverter. They provide panel-level monitoring ($0.12–$0.20/W) and isolate the performance impact of shading or panel faults. According to EnergySage comparison data, optimizers typically increase energy harvest by 2–5% over string inverters on partially shaded rooftops.
Microinverters (Enphase, AP Systems) convert DC to AC at each panel, providing full panel-level monitoring and fault isolation ($0.18–$0.30/W). Solar Insure field data from California indicated that homes with microinverters saw a 5–10% increase in energy output compared to string inverter systems — primarily because microinverters eliminate string-level mismatch losses and allow each panel to operate at its own optimum.
U.S. Residential Solar Market: Monitoring Architecture Share (2025 Estimate)
U.S. Residential
2025 Est.
■ DC Optimizers 33%
■ String Inverters 20%
Source: EnergySage Marketplace Data, Wood Mackenzie U.S. Solar Monitor 2025. Microinverters have gained share steadily due to NEC rapid-shutdown requirements and panel-level monitoring demand.
Interpreting Performance Data and Alarms
Monitoring dashboards generate daily production data, but raw numbers are meaningless without context. The key metric is specific yield (kWh/kWp) — the energy produced per kilowatt of installed capacity. A well-performing system in Phoenix should produce 1,700–1,900 kWh/kWp annually; the same system in Seattle might produce 1,100–1,300 kWh/kWp. Deviation of more than 10% from the expected specific yield warrants investigation.
Most monitoring platforms generate automated alerts for zero production (inverter fault or grid outage), sudden drops exceeding 20% (possible string failure, shading event, or panel damage), and gradual trending below baseline (degradation exceeding warranted rate). The most actionable data comes from module-level monitoring, where a single underperforming panel stands out clearly against its neighbors — enabling targeted maintenance rather than expensive full-array inspections.
When to Call a Professional
Homeowners and facility managers should contact a certified solar technician when monitoring data shows sustained underperformance that cannot be explained by weather or soiling, when visible damage (cracked glass, discolored cells, scorched junction boxes) is observed, when ground-fault or arc-fault alerts occur (these indicate potentially dangerous electrical conditions), or when the system is older than 10 years and has never received a professional inspection. The investment in a comprehensive inspection — typically $300–$700 for a residential system — is minimal compared with the cost of undetected degradation compounding over years.
Insurance and Risk Management for Solar Installations
Coverage Types, Limits, and Exclusions
According to Nationwide Insurance, solar panel coverage is included in most homeowners insurance policies as part of dwelling coverage — meaning permanently attached roof-mounted panels are insured against the same perils as the roof itself (fire, wind, hail, falling objects). However, coverage limits, deductibles, and exclusions vary dramatically between policies.
The critical question is whether the policy covers replacement cost or actual cash value (ACV). Replacement cost policies pay to replace damaged panels with equivalent new equipment. ACV policies deduct depreciation — meaning a 10-year-old panel system might receive only 50–60% of its replacement cost, leaving the owner with a significant out-of-pocket shortfall. For a 10 kW system with a $25,000 replacement cost, the difference between replacement cost and ACV coverage at year 10 could be $10,000–$12,500.
Ground-mounted and carport-mounted systems may not be covered under standard dwelling policies — they may require a separate “other structures” endorsement or a standalone equipment policy. Leased systems and power purchase agreements (PPAs) typically shift insurance responsibility to the system owner (the leasing company), but the homeowner should verify this in writing.
Documentation and Claim Tips
Successful insurance claims require documentation that most solar owners do not prepare in advance. Before any damage event occurs, owners should maintain a file containing the original purchase contract and invoice, the system design document (panel layout, string diagram, inverter specifications), all warranty certificates with serial numbers, photographs of the installation at completion (documenting condition of all panels, wiring, and mounting hardware), and ongoing monitoring data exports showing baseline performance. After damage, photograph everything before any cleanup or repair, obtain a written damage assessment from a certified solar technician, file the insurance claim promptly (most policies have 60–90 day filing deadlines), and do not authorize repairs until the insurer’s adjuster has inspected the damage.
Common Risk Scenarios and Mitigation
The most frequent insurance claims for solar installations involve hail damage (cracked glass, cell micro-fractures), wind uplift (mounting hardware failure, panels detached from rails), falling tree limbs (physical impact), lightning strikes (inverter failure, ground-fault damage), and fire (junction box overheating, arc faults in wiring). Mitigation strategies include selecting panels with Class A fire ratings and IEC 61215 hail certification, specifying mounting systems rated for local wind speeds with appropriate safety factors, maintaining tree clearance around the array, installing surge protection on the AC and DC sides of the system, and conducting regular electrical inspections to detect loose connections before they become arc-fault ignition sources.
Making the Purchase: Taking It All Into Account
Budgeting and Total Cost of Ownership
The sticker price of a solar panel system is a misleading metric. True total cost of ownership (TCO) over a 25-year period includes the initial equipment and installation cost, inverter replacement (string inverters typically require replacement at year 12–15, costing $1,500–$4,000), ongoing maintenance and cleaning costs, insurance premium increases attributable to the solar installation, monitoring service fees (if applicable), and the opportunity cost of capital invested.
25-Year Total Cost of Ownership: 10 kW Residential System
| Cost Category | Budget System (Glass-BS, String Inverter) | Mid-Range System (Glass-Glass, Optimizers) | Premium System (Glass-Glass N-type, Microinverters) |
|---|---|---|---|
| Equipment + Installation | $18,000 | $24,000 | $30,000 |
| Federal ITC (30%) | -$5,400 | -$7,200 | -$9,000 |
| Net Initial Cost | $12,600 | $16,800 | $21,000 |
| Inverter Replacement (Yr 13) | $2,500 | $0 (25-yr warranty) | $0 (25-yr warranty) |
| Maintenance (25 yr total) | $4,500 | $3,500 | $3,000 |
| Insurance Increase (25 yr) | $2,500 | $2,500 | $2,500 |
| 25-Year TCO | $22,100 | $22,800 | $26,500 |
| 25-Year Energy Produced | 310,000 kWh | 355,000 kWh | 380,000 kWh |
| Levelized Cost ($/kWh) | $0.071 | $0.064 | $0.070 |
| 25-Year Savings (at $0.15/kWh avg.) | $24,400 | $30,450 | $30,500 |
Assumptions: Location with 1,500 peak sun hours/year, utility rate starting at $0.13/kWh escalating 2.5%/year, cleaning 2x/year at $250/visit, electrical inspection annually at $350. Federal ITC at 30% (current through 2032 under the Inflation Reduction Act). Degradation rates per technology type as discussed in the degradation section above.
The mid-range glass-glass system with DC optimizers delivers the lowest levelized cost of energy at $0.064/kWh — 10% cheaper than the budget system despite costing $4,200 more upfront — because it produces 45,000 more kWh over its lifetime and avoids the $2,500 inverter replacement cost. This illustrates why experienced buyers evaluate TCO, not sticker price.
Supplier Due Diligence and Evaluating Track Records
A warranty is only as good as the company that stands behind it. Buyer due diligence should include verifying the manufacturer’s position on Bloomberg New Energy Finance’s Tier-1 module maker list (an indicator of bankability, not quality, but a useful baseline), reviewing independent test results from PVEL’s PV Module Reliability Scorecard, checking the manufacturer’s financial statements (publicly listed companies) or credit reports (private companies), asking for references from completed installations at least 5 years old, and confirming local service infrastructure (distribution centers, certified installer networks, warranty fulfillment partners).
Red flags include manufacturers that have only been in business for fewer than 5 years offering 25-year warranties, lack of independent test certifications (relying only on in-house testing), unusually low pricing with no clear cost advantage explanation, and inability to provide references from installations older than 3 years. The Jia Mao Bipv manufacturer selection guide provides an expanded framework for evaluating solar panel suppliers, including detailed criteria for assessing warranty terms, production capacity verification, and certification authenticity checks. Their own facility operates with an annual production capacity of 3 GW, an intelligent MES production management system for full traceability, and automated production lines incorporating advanced laminators and precision laser cutting — factors that buyers can verify through factory audits.
Negotiating Warranties, Service Terms, and Maintenance Plans
Warranties are not always fixed — especially for commercial and utility-scale purchases. Buyers with leverage (large order quantities, strategic accounts, or exclusive regional distribution agreements) can negotiate extended product warranty terms (from 12 to 25 years), enhanced performance guarantees (from 80% to 85% at year 25), inclusion of labor and shipping costs in warranty claims (standard warranties often cover only the replacement panel, not the labor to install it), and transferability provisions (ensuring the warranty transfers to a new owner if the property is sold). For residential buyers, the most important negotiation point is usually labor coverage — a “free replacement panel” is meaningless if the labor cost to remove the old panel, install the new one, and recommission the system exceeds $500.
Video: Solar Panel Warranties and Maintenance Explained
This comprehensive video from a solar industry professional breaks down the key warranty types, what they actually cover, and the maintenance practices that keep your coverage valid over the long term:

A glass solar panel purchase is a 25-year commitment, and the variables that determine whether that commitment delivers strong returns — warranties, certifications, glass type, degradation rates, maintenance protocols, monitoring architecture, and insurance coverage — are precisely the variables that receive the least attention during most buying decisions. The data in this guide tells a consistent story: informed buyers who evaluate total cost of ownership rather than sticker price, who verify certifications through actual test certificates rather than datasheet logos, who select glass-glass construction with appropriate coatings for their climate, and who implement structured maintenance and monitoring programs consistently outperform those who optimize only for initial cost.
The financial stakes are meaningful. The difference between a premium glass-glass system and a budget glass-backsheet system on a 10 kW residential installation is approximately 70,000 kWh of additional energy production and $6,000 in additional net savings over 25 years — more than justifying the upfront premium. Factor in avoided inverter replacements, lower maintenance costs from self-cleaning coatings, and superior warranty coverage, and the case becomes overwhelming.
Before signing any purchase order, request the full IEC 61215 and IEC 61730 (or UL 61730) test certificates — not just the logo. Verify the manufacturer’s financial stability through BNEF Tier-1 status and independent reliability scorecards. Confirm that the product warranty covers a minimum of 15 years (25 for premium brands) and that the performance warranty guarantees at least 84% output at year 25. Ensure your homeowners or commercial property insurance covers the system at replacement cost. And establish a written maintenance schedule from day one — because the maintenance exclusion in most performance warranties is the single most common reason claims are denied.
For buyers evaluating BIPV glass solutions that combine energy generation with architectural building materials, manufacturers like Jia Mao Bipv offer a comprehensive product range — from transparent BIPV glass for facades and skylights to high-efficiency N-type panels for conventional rooftop applications — backed by 25-year performance warranties, IEC-certified testing, and a 3 GW manufacturing facility with full digital traceability.
Frequently Asked Questions (FAQs)
1. What is the difference between product and performance warranties for glass solar panels?
A product warranty covers manufacturing defects such as cracked glass, delamination, faulty junction boxes, and premature corrosion — the manufacturer repairs or replaces the panel if it fails due to a workmanship flaw. A performance warranty guarantees minimum power output over time, typically ensuring at least 90% of rated output at year 10 and 80–85% at year 25. If independent testing confirms that a panel has degraded below its warranted curve, the manufacturer must supplement or compensate. Both warranties are essential — the product warranty protects against catastrophic failure, while the performance warranty protects against gradual degradation that silently erodes your return on investment.
2. Which certifications should I prioritize when buying glass solar panels?
At minimum, verify IEC 61215 (design qualification covering thermal cycling, damp heat, mechanical load, and hail impact) and IEC 61730 (safety qualification covering electrical shock, fire resistance, and mechanical integrity). For U.S. installations, UL 61730 listing is mandatory. For BIPV applications, UL 7103 certification is the dedicated standard. Additionally, verify an appropriate fire classification (Class A, B, or C per UL 790) based on your local building code requirements. Request actual test certificate numbers from the manufacturer, not just logos on a datasheet.
3. How often should I clean solar panels and when should I call a professional for maintenance?
Clean panels at least twice per year under normal conditions — more frequently (quarterly or monthly) in dusty, agricultural, or coastal environments. Use deionized water and a soft brush; avoid chemicals, abrasive pads, and high-pressure washers. Call a professional when monitoring data shows sustained underperformance exceeding 10% of expected output, when you observe visible damage (cracked glass, discolored cells, scorched connectors), when your system triggers ground-fault or arc-fault alarms, or when the system is over 10 years old and has never received a professional electrical inspection.
4. Does homeowners insurance cover glass solar panels?
Most homeowners insurance policies cover roof-mounted solar panels under dwelling coverage, treating them as permanent fixtures of the home. However, critical details vary: some policies cover replacement cost while others cover only actual cash value (depreciated), ground-mounted systems may require a separate endorsement, and flood damage is typically excluded. Review your policy specifically for solar equipment coverage limits, verify whether labor costs for replacement are included, and document your system thoroughly (serial numbers, photographs, monitoring data) before any damage event occurs.
5. What degradation rate should I expect from glass-glass solar panels?
Premium glass-glass panels with N-type cells (TOPCon, HJT) typically degrade at 0.25–0.40% per year after an initial first-year drop of 1–2%. Standard glass-backsheet mono PERC panels degrade at 0.5–0.7% per year. Over 25 years, a glass-glass N-type panel retains approximately 90–93% of its rated output versus 80–85% for glass-backsheet panels — a difference of 10,000–15,000 kWh on a 10 kW system. The glass-glass construction’s superior moisture barrier is the primary driver, as it prevents PID, delamination, and interconnect corrosion that accelerate degradation in glass-backsheet designs.
6. How does glass type (tempered vs. laminated) affect solar panel longevity?
Tempered glass is 4–5x stronger than annealed glass and is the standard front layer on virtually all solar panels. It passes the IEC 61215 hail impact test and fractures into small, non-hazardous granules. Laminated glass bonds multiple layers with a PVB or SGP interlayer, holding fragments together after breakage — making it mandatory for overhead BIPV applications (skylights, canopies) and hurricane-prone regions. Jia Mao Bipv’s BIPV laminated glass carries a 25-year structural integrity warranty covering adhesion and impact resistance, meeting both PV performance and building-safety requirements simultaneously.
7. What is the best monitoring architecture for detecting panel-level issues?
Microinverters provide the highest diagnostic granularity, converting DC to AC at each panel and reporting individual panel production in real time. DC optimizers offer similar panel-level monitoring while using a central inverter for DC-AC conversion. String inverters monitor only at the string level and cannot isolate individual panel faults without physical inspection. For glass solar panel systems where early detection of micro-cracks and degradation is critical, module-level monitoring (microinverters or optimizers) pays for its premium through faster fault identification and reduced diagnostic costs over the system’s 25-year life.
8. How do I evaluate whether a solar panel manufacturer will still exist in 25 years to honor my warranty?
Check the manufacturer’s position on the BNEF Tier-1 module maker list, review their annual revenue and financial stability (publicly listed companies file audited financials), examine their manufacturing capacity and investment trajectory, and verify independent reliability scorecard results from PVEL. For additional protection, consider third-party warranty insurance products that guarantee coverage even if the manufacturer exits the market.
9. Can anti-reflective coatings on glass solar panels degrade, and how do I detect it?
AR coatings can degrade, particularly in harsh desert or coastal environments where lower-quality silica sol-gel coatings may lose effectiveness within 5–7 years. Premium pre-temper AR coatings (applied before the glass enters the furnace) bond more permanently and last the full 25–30 year module life. Detect coating degradation through monitoring data — if a panel’s output declines faster than its warranted degradation rate and soiling has been ruled out through cleaning, AR coating wear is a likely cause. Spectral reflectance measurement by a qualified lab can confirm this diagnosis.
10. What is the total cost of maintaining a glass solar panel system over 25 years?
For a typical 10 kW residential system, expect to spend $3,000–$4,500 on maintenance over 25 years: approximately $150–$350 per cleaning visit (2x annually), $200–$500 per annual electrical inspection, and $300–$600 every 2–3 years for thermal imaging. Budget systems with string inverters should add $2,000–$4,000 for inverter replacement at year 12–15. Premium systems with microinverters or optimizers carrying 25-year warranties avoid this cost. The total maintenance investment represents roughly 12–18% of the system’s initial cost — and delivers a return of 3–5x through sustained energy production and preserved warranty coverage.


-300x300.jpg)