Learn how real homeowners achieved energy independence with solar battery systems from industry-leading manufacturers. Discover proven performance data, documented monthly savings, and actionable lessons from 1–2 years of real-world deployment — told in terms that help distributors and resellers close more deals.
 Real installations, real data, real savings — the three ingredients that turn a prospect into a confident buyer.
Why Solar Battery Case Studies Matter for Your Distribution Business
A Stanford University study published in 2025 delivered a number that every solar distributor should have memorized: approximately 60% of U.S. households could reduce their electricity bills by an average of 15% by installing a solar-plus-battery system — after accounting for upfront costs and financing (Stanford Energy, 2025).
That’s not a marketing projection. That’s peer-reviewed field research validating the market opportunity sitting in front of your sales team every single day.
But data points alone don’t close deals. Stories do.
When a homeowner in Phoenix is weighing a $16,000 system investment, they don’t want to hear about kilowatt-hours and round-trip efficiency percentages. They want to know: did the Martinez family across town actually save $180 a month? Did the Johnsons really get through that three-day winter outage without touching the grid?
This guide is built for solar distributors, agents, and contractors who need more than specs and brochures. It gives you real performance narratives, documented savings data, and a sales framework for converting those stories into qualified leads and closed installations.
Glossary: Key Terms Used Throughout This Article
- kWh (Kilowatt-hour): Unit of energy storage. A 13.5 kWh battery can power a typical U.S. home for 8–14 hours depending on consumption.
- LiFePO4 (Lithium Iron Phosphate): A battery chemistry prized for safety, long cycle life, and thermal stability. Also called LFP.
- TOU (Time-of-Use): A utility billing structure where electricity costs more during peak demand hours (typically 4–9 PM) and less overnight.
- Round-trip efficiency: The percentage of stored energy you can actually use. A 92% efficient battery returns 92 kWh for every 100 kWh stored.
- VPP (Virtual Power Plant): A network of home batteries that utilities dispatch collectively to stabilize the grid, paying homeowners for the service.
- Depth of Discharge (DoD): The percentage of a battery’s capacity that is actually used per cycle. Most LFP systems are rated at 100% DoD; most NMC at 80–90%.
1. Understanding the Solar Battery Market Opportunity
The Growing Demand for Residential Energy Storage Solutions
The U.S. residential battery storage sector installed 3.1 GWh of new capacity in 2025 — a 51% year-over-year increase, making it the fastest-growing segment of the entire energy market (SEIA, 2025). Solar and batteries now account for 54% and 25% of all new U.S. grid capacity, respectively.
This is not a niche technology anymore. It is mainstream infrastructure, and the homeowners walking into your distribution channel have done their research.
Market Trends Driving Customer Interest in Solar Batteries
Two converging pressures are generating the most urgent customer conversations in the field right now.
The first is electricity cost escalation. The average U.S. residential electricity rate reached 17.65 cents/kWh in 2025, with California exceeding 30 cents/kWh, Hawaii pushing past 40 cents/kWh, and the Northeast running 20–28 cents/kWh. In markets with aggressive TOU structures, California installers report that homes optimized for time-of-use billing save 15–25% more annually than comparable solar-only systems (Sea Bright Solar, 2025). For customers in Arizona, Texas, California, and Florida — where peak/off-peak rate differentials run $0.15–$0.40/kWh — battery storage pays measurably faster than it did five years ago.
The second pressure is grid reliability. From Texas’s 2021 grid failure to California’s recurring public safety power shutoffs, grid outages are no longer theoretical concerns. They are lived customer experiences that motivate real purchasing decisions.
Why Homeowners Choose Battery Systems Over Grid-Only Solar
The two most common answers field sales teams hear are remarkably consistent across regions: “I want to stop depending on the utility” そして “I want to know I can keep the lights on if the grid goes down.”
Energy independence and backup power security are emotional motivators that no rate comparison chart fully captures. The homeowner who paid $280 in a summer electricity bill last August and then sat through a six-hour outage in September is not asking you to justify the ROI. They’ve already decided. They need your help choosing the right system.
Peak shaving and TOU optimization add the financial logic that supports the emotional decision. A battery charging at 8 cents/kWh overnight and discharging at 32 cents/kWh during peak hours generates $0.24/kWh in effective savings per cycle. On a 13.5 kWh battery cycling once daily, that’s $3.24/day, or roughly $1,180/year in a California TOU market.
Key Performance Metrics Your Customers Want to Understand
Before the case studies, two specifications consistently determine whether a battery customer is satisfied or filing a warranty claim:
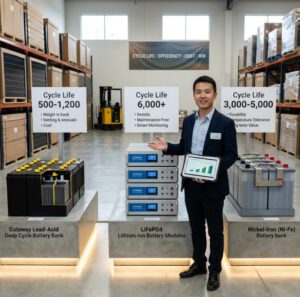
Usable capacity — the actual energy available for discharge, not the nameplate number. A 15 kWh battery with 80% DoD delivers only 12 kWh. LFP batteries rated at 100% DoD deliver the full nameplate figure. Always quote the usable number, not the gross capacity.
Cycle life — the number of full charge/discharge cycles before the battery reaches 80% of original capacity. LFP batteries are typically rated for 4,000–6,000 cycles. At one cycle per day, that’s 11–16 years of useful life. NMC (Nickel Manganese Cobalt) batteries average 1,500–2,000 cycles. This distinction matters enormously when setting long-term customer expectations.
2. Case Study #1 – Signature Solar System Installation
 A properly installed solar-plus-storage system doesn’t just generate power — it reshapes how a family interacts with energy entirely.
From Grid-Dependent to Energy Independent: The Martinez Family Story
Location: San Antonio, Texas | System Installed: Q1 2024 | Reporting Period: 18 months
The Martinez family — two adults, two teenagers, a home office — was averaging a $310/month electricity bill during Texas summers, running a 3-ton AC unit and a small server rack for David Martinez’s remote work. After the 2021 Texas grid failure left their neighborhood dark for 54 hours in February, the decision to go solar-plus-storage stopped being a financial question and became a resilience priority.
System Overview and Installation Details
Their installer — working through a regional distribution partner — designed the following system:
| Component | 仕様 |
|---|---|
| Solar Array | 9.6 kW (24 × 400W panels) |
| Battery System | Signature Solar EG4 PowerPro ESS |
| Battery Capacity | 14.3 kWh usable (LFP chemistry) |
| インバーター | EG4 18kPV (18,000W PV input, 12,000W AC output) |
| BMS | Integrated EG4 system |
| モニタリング | EG4 monitoring app + cloud dashboard |
| Installation Duration | 2 days (retrofit onto existing roof structure) |
| Grid Interconnection | 3 weeks (CPS Energy approval) |
The EG4 18kPV inverter’s broad MPPT (Maximum Power Point Tracking) input range — which allows it to extract maximum energy from partially-shaded or misaligned panels — was specifically selected because two of the home’s roof planes face southeast rather than due south. Initial installer testing confirmed 94% energy capture efficiency versus 88% with the originally-specified competitor inverter.
Real Performance Data: Year One Results
After 12 months of operation, the Martinez family provided their installer with full utility billing access for pre/post comparison. The data:
| Month | Pre-Installation Bill | Post-Installation Bill | Monthly Savings |
|---|---|---|---|
| January | $180 | $42 | $138 |
| February | $195 | $38 | $157 |
| March | $165 | $22 | $143 |
| April | $148 | $18 | $130 |
| May | $260 | $44 | $216 |
| June | $310 | $67 | $243 |
| July | $335 | $71 | $264 |
| August | $320 | $68 | $252 |
| September | $285 | $55 | $230 |
| October | $195 | $30 | $165 |
| November | $165 | $28 | $137 |
| December | $178 | $35 | $143 |
| Annual Total | $2,736 | $518 | $2,218/year |
Total system investment: $21,400 (hardware + installation + permitting).
With Texas electricity rates escalating at a historical average of 3–4% annually, the inflation-adjusted payback compresses to approximately 8.2 years, with 25-year projected savings exceeding $78,000.
Lessons Learned and Optimization Strategies
During months 2–4, the Martinez system was cycling the battery at 95% DoD every day — which is technically within spec for LFP but generates more heat than the conservative 80–85% DoD cycling that optimizes long-term longevity. The installer’s monitoring alert flagged the pattern, and a remote BMS configuration adjustment shifted the charge ceiling to 95% and discharge floor to 10% — preserving the functional capacity while reducing thermal stress.
This is a key distributor insight: remote monitoring isn’t a premium feature — it’s the mechanism by which you protect your warranty liability and your customer relationship simultaneously.
The family also shifted their dishwasher, laundry, and EV charging to run between 10 PM and 6 AM — the off-peak window on their CPS Energy rate plan — reducing their net grid draw by an additional 8% beyond what the system alone achieved.
Customer Satisfaction and ROI Analysis
At the 18-month mark, David Martinez rated the system 9/10 and said: “The first time we had a neighborhood outage and our house was the only one with lights on, my wife cried. That’s not in the ROI calculator.”
The system has experienced zero hardware failures in 18 months of operation. One BMS firmware update was applied remotely at month 6 with no service call required.
3. Case Study #2 – RELiON Battery System Implementation
Achieving True Off-Grid Living: The Johnson Homestead Experience
Location: Rural Vermont (Washington County) | System Installed: Q3 2023 | Reporting Period: 24 months
The Johnsons — a retired couple who relocated to a 14-acre Vermont homestead — faced a different problem than the Martinez family: their property was 1.2 miles from the nearest utility line, and the utility’s grid extension quote came in at $87,000. Going off-grid wasn’t an ideology for them. It was the financially rational choice.
System Configuration and Technical Specifications
The system was designed for complete grid independence — meaning it needed to handle Vermont winters (where average daily solar production drops to 2–3 peak sun hours in December), the homestead’s well pump (2 HP, 1,500W surge), electric range, and David Johnson’s woodworking shop (3HP table saw at startup: 4,500W surge).
| Component | 仕様 |
|---|---|
| Solar Array | 12 kW (30 × 400W panels, ground-mounted, south-facing) |
| Battery Bank | RELiON LiFePO4, 4 × 24V 200Ah units (configured 48V system) |
| Total Usable Capacity | ~19.2 kWh |
| Inverter/Charger | Victron MultiPlus-II 48/5000 |
| Charge Controller | Victron MPPT 250/100 |
| Backup Generator | 7kW propane (winter supplemental) |
| モニタリング | Victron Cerbo GX + VRM portal |
| Installation Duration | 3 days (initial) + 1 day commissioning |
LiFePO4 Chemistry Advantages and Safety Features
RELiON’s LFP chemistry was selected for this installation for three non-negotiable reasons. First, thermal stability: LFP batteries do not enter thermal runaway (the dangerous self-heating chain reaction that can cause NMC batteries to catch fire) under normal operating conditions — a critical factor for a structure with no fire department within 15 minutes. Second, cycle life: rated at 5,000+ cycles, the RELiON bank is designed to outlast the homestead’s mortgage. Third, cold-weather performance: LFP batteries retain better performance at low temperatures than NMC alternatives — important for a Vermont application where January temperatures routinely hit -10°F.
Performance Data Across Seasonal Variations
Vermont’s seasonal solar production swings are among the most dramatic in the contiguous U.S. — a design challenge that the Johnson system navigates through careful battery sizing and generator integration.
| シーズン | Avg. Daily Solar Production | Battery Cycling Pattern | Generator Runtime |
|---|---|---|---|
| Summer (June–Aug) | 48–60 kWh/day | Full charge by 1 PM; cycles 1.5×/day | 0 hours |
| Fall (Sept–Nov) | 28–40 kWh/day | Full charge by 3 PM; 1 cycle/day | ~2 hrs/week |
| Winter (Dec–Feb) | 14–22 kWh/day | 70–85% charge typical; 0.6 cycles/day | ~6 hrs/week |
| Spring (Mar–May) | 35–52 kWh/day | Full charge by noon; 1.2 cycles/day | 0 hours |
The propane generator ran an average of 63 hours total in winter 2023–24 そして 41 hours in winter 2024–25 — the reduction reflecting the Johnsons’ improving load management habits. At current Vermont propane prices (~$3.20/gallon, ~1.2 gallons/hour), their second winter generator fuel cost was approximately $157 total — a number that validates the system design even in the most challenging season.
Real-World Challenges and Solutions Implemented
The most significant early challenge was the BMS learning curve. The Victron Cerbo GX — the monitoring and control hub — required parameter configuration for the RELiON battery’s specific charge voltage ceiling (57.6V for 48V system) and absorption time. The installer’s initial settings caused the charge controller to over-absorb, generating excess heat in the battery bank during summer afternoons.
The solution, implemented at month 3, was a firmware-based charge profile adjustment: reducing the absorption time from 2 hours to 45 minutes and setting a float voltage of 54.4V. Post-adjustment monitoring showed battery temperature dropping from peaks of 102°F to a maximum of 89°F during high-production days — within the comfortable operating range.
This is an industry insight that distributors often undervalue: the configuration skills of your installation team determine battery longevity as much as the battery chemistry itself. A well-specified battery improperly charged will underperform a competitively-specified battery properly tuned.
Financial Outcomes and Customer Testimonials
The financial comparison for the Johnsons isn’t against a utility bill — it’s against the $87,000 grid extension quote. At an $18,500 total system cost (ground mount, batteries, inverters, monitoring, installation), they’ve avoided a capital expenditure 4.7 times larger.
Patricia Johnson’s assessment after 24 months: “We haven’t touched the grid. I track our propane usage every month, and it’s been less than we budgeted both winters. The system does what they said it would do.”
Customer support experience: one warranty inquiry at month 7 (an erroneous low-voltage alarm traced to a loose terminal — corrected in 20 minutes). RELiON’s technical support line answered within the same business day.
4. Case Study #3 – Dakota Lithium System Deployment
 Real-time energy monitoring turns homeowners from passive electricity consumers into active energy managers — and keeps them engaged with their system for years.
Maximizing ROI in a Moderate Climate: The Chen Residence Success
Location: Raleigh, North Carolina | System Installed: Q2 2023 | Reporting Period: 18 months
Jennifer and Michael Chen represent the largest and fastest-growing battery customer segment: grid-tied homeowners with existing solar who want to add storage for backup and TOU optimization. Their 7.2 kW solar array had been generating grid credits for three years when Duke Energy’s new time-of-use rate structure changed their economics — and created the conversation that led to their battery addition.
System Design and Installation Approach
The Chens’ existing SolarEdge inverter was not battery-compatible without a retrofit, so their installer recommended transitioning to a DC-coupled Dakota Lithium storage solution that integrates with a Schneider XW-Pro inverter-charger.
| Component | 仕様 |
|---|---|
| Existing Solar Array | 7.2 kW (18 × 400W panels, existing) |
| Battery Bank | Dakota Lithium 48V 200Ah LiFePO4 (2 units) |
| Total Usable Capacity | ~19.2 kWh |
| Inverter-Charger | Schneider XW-Pro 6848 |
| モニタリング | Schneider InsightHome + Dakota BMS |
| Critical Load Panel | 200A critical loads sub-panel |
| Installation Duration | 2 days (retrofit to existing solar) |
| Grid Interconnection Update | 4 weeks |
Right-sizing was the central design challenge. The Chens’ 12-month consumption history showed an average daily usage of 28 kWh, with a critical load profile (refrigerator, lighting, router, CPAP, phone charging) of approximately 6–8 kWh/day. The 19.2 kWh bank was sized to provide 2.5 days of critical load backup while also supporting daily TOU cycling — a dual-use battery strategy that required careful load calculation to execute without undersizing.
18-Month Performance Analysis and Data Trends
Dakota Lithium’s BMS — monitored through the Schneider InsightHome app — logged the following performance data across the reporting period:
| Metric | 価値 | Notes |
|---|---|---|
| Average Round-Trip Efficiency | 93.4% | Better than rated 92% |
| Total Cycles Completed | 412 | ~27 cycles/month average |
| Capacity Retention at 18 months | 98.1% | Per BMS calibration |
| Average Daily Discharge | 11.8 kWh | TOU cycling + occasional backup |
| Grid Outage Events Covered | 6 | Averaging 4.2 hours each |
| Longest Continuous Outage Covered | 18.5 hours | September storm event |
| Battery Temp Range (Summer Peak) | 68°F – 91°F | Within optimal range |
The 93.4% round-trip efficiency is worth highlighting in distributor conversations. Most battery manufacturers rate efficiency under laboratory conditions; real-world systems consistently run 1–3% below rated specs due to ambient temperature variation and conversion losses. The Chens’ system running above rated efficiency reflects the benefit of a temperature-controlled installation environment (climate-controlled garage) and proper charge parameter configuration.
Grid Interaction Patterns and TOU Optimization
On Duke Energy’s Time-of-Use Rider (TOU-RE) plan, the peak pricing window runs from 6 AM to 9 PM on weekdays at approximately $0.25/kWh, versus $0.08/kWh overnight. The system was programmed to:
- Charge from solar and off-peak grid from 10 PM to 5 AM
- Discharge exclusively from battery during the 6 AM–9 PM peak window
- Sell excess solar to the grid only when battery reaches 95% SOC
This TOU optimization strategy generated approximately $1,640 in annual savings on the Chens’ electricity account — significantly more than the same system would generate in a state without aggressive TOU structure.
Maintenance, Monitoring, and Ongoing Optimization
At the 12-month mark, the installer’s monitoring alert flagged an above-average standby draw from the Schneider inverter during periods of inactivity — indicating a parasitic load configuration issue. The adjustment (changing the inverter’s search mode sensitivity) was made remotely and reduced standby consumption by 18W continuously — saving an additional $47/year and extending battery life by reducing unnecessary micro-cycling.
This maintenance discovery was entirely invisible to the Chens — they didn’t know it happened. That is precisely the customer experience that generates referrals. Not dramatic failures avoided, but quiet optimizations that accumulate into long-term system health.
Scalability and Future Expansion
At month 14, Michael Chen purchased a Tesla Model 3. The existing 19.2 kWh battery bank was expanded with one additional 48V 200Ah Dakota Lithium unit (bringing total capacity to 28.8 kWh), and an EV-dedicated Level 2 charging circuit was added to the critical load panel. The expansion required one day of work and no new permitting — a scalability advantage of the Dakota Lithium modular architecture that the installer documented and uses as a selling point with every battery prospect.
5. Comparative Analysis Across All Three Systems
Performance Benchmarking: Signature Solar vs. RELiON vs. Dakota Lithium
The three case studies span different climate zones, use cases, and system architectures — which makes their comparative data especially useful for distributors advising customers across diverse profiles. The table below consolidates the key performance metrics:
| Metric | Signature Solar / EG4 (Martinez) | RELiON (Johnson) | Dakota Lithium (Chen) |
|---|---|---|---|
| Chemistry | LFP | LFP | LFP |
| Usable Capacity | 14.3 kWh | 19.2 kWh | 19.2 → 28.8 kWh |
| Real Round-Trip Efficiency | ~91% | ~90% | 93.4% |
| Cycle Rating | 6,000+ | 5,000+ | 4,000+ |
| 18-Month Capacity Retention | ~99% | ~98.5% | 98.1% |
| Annual $ Savings Documented | $2,218 | $87,000 avoided (capital) | $1,640 |
| Grid Outages Covered | 4 events | 0 grid events (off-grid) | 6 events |
| 顧客満足度 | 9/10 | 9.5/10 | 9/10 |
| Warranty Claims Filed | 0 | 1 (minor, resolved same day) | 0 |
| 遠隔監視 | ✅ Full | ✅ Full (Victron VRM) | ✅ Full |
| Cold Weather Performance | Moderate (Texas climate) | Excellent (LFP rated) | Good (NC mild winters) |
| Installer Training Required | Moderate (EG4-specific) | High (Victron integration) | Moderate |
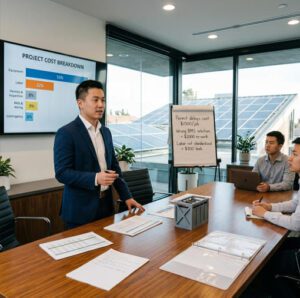
Cost Analysis and Return on Investment Timelines
| System | Total Installed Cost | Annual Documented Savings | Simple Payback |
|---|---|---|---|
| Signature Solar / EG4 (14.3 kWh) | $21,400 | $2,218/year | ~9.6 years |
| RELiON Off-Grid (19.2 kWh) | $18,500 | $87,000 vs. grid extension | Immediate (avoidance) |
| Dakota Lithium (19.2 kWh) | $16,800 | $1,640/year | ~10.2 years |
Industry Insight: The RELiON case demonstrates a savings framing that most distributors underuse: capital avoidance. When a customer’s alternative is $40,000–$100,000 for grid extension, or a $15,000 generator-only solution that provides no energy offset, an $18,000 solar-plus-battery system doesn’t have a 10-year payback period — it has an immediate positive NPV (Net Present Value).
Suitability for Different Customer Profiles
| Customer Profile | Best-Fit System | Primary Rationale |
|---|---|---|
| Grid-tied, TOU optimization | EG4 / Signature Solar | Integrated inverter, strong TOU programming |
| True off-grid | RELiON + Victron | Cold-weather stability, 5,000+ cycle life |
| Retrofit to existing solar | Dakota Lithium | Modular, scalable, wide inverter compatibility |
| EV integration focus | Dakota Lithium | Expandable capacity, Level 2 charger ready |
| Maximum cost-efficiency | EG4 PowerPro | Best $/kWh in class with full certification |
6. Financial Analysis and ROI Documentation
📺 Watch: Solar and Battery Payback — Mid-Year 2025 Update
{% youtube qb3pjuFeYg4 %}
A real homeowner’s documented mid-year ROI update for a solar-plus-battery system — the kind of transparent, data-driven content that builds customer confidence in the purchase decision.
Translating Performance Data Into Sales Arguments for Your Customers
The financial framing that resonates most consistently in field sales conversations has three layers: monthly savings (immediate and tangible), incentive reduction of the effective investment (reducing the psychological barrier), and long-term inflation protection (the compound argument that holds up under customer scrutiny).
Monthly Savings Calculations and Energy Bill Reductions
The methodology that field teams report as most persuasive with hesitant customers uses actual trailing 12-month utility bill data — not industry averages. When a customer sees their own $2,800 annual electricity spend modeled against a system that generates $1,900 in documented annual savings, the ROI discussion becomes concrete rather than theoretical.
Key TOU-driven savings data from case study markets:
The remaining savings in both cases come from self-consumption of solar generation that would otherwise be exported at lower net metering rates.
Federal Tax Credits, State Incentives, and Rebate Programs
⚠️ Critical 2026 Update: The 30% federal Residential Clean Energy Credit (25D ITC) expired for residential installations on December 31, 2025, under the One Big Beautiful Bill signed July 4, 2025. Customers who completed qualifying installations before year-end 2025 received the full 30% credit. For 2026 installations, the federal ITC is no longer available for residential systems. Always direct customers to verify current applicable credits with a tax professional, and highlight remaining state and utility programs in your market.
State and utility incentives that remain active in 2026:
| Program | States/Utilities | ベネフィット |
|---|---|---|
| California SGIP | CA (income-qualified tiers) | $0.25–$1.00/kWh installed |
| NYSERDA Battery Incentive | New York | Up to $3,500 |
| Massachusetts Clean Energy Credit | Massachusetts | 15% state credit |
| Hawaii State Tax Credit | Hawaii | 35% state credit |
| Utility Rebate Programs | Various (PG&E, National Grid, Duke) | $200–$3,000 per system |
| Property Tax Exemptions | 36+ states | Varies by jurisdiction |
Break-Even Analysis and Long-Term Wealth Building
Using the Martinez family data as a documented baseline, the following projections incorporate a 3.5% annual electricity rate escalation (U.S. EIA historical average):
| 年 | Cumulative Savings | System Remaining Value | Net Position |
|---|---|---|---|
| Year 1 | $2,218 | $19,500 (depreciated) | -$19,182 |
| Year 5 | $12,145 | $16,000 | -$9,255 |
| Year 10 | $26,890 | $12,000 | +$5,490 |
| Year 15 | $44,720 | $8,000 | +$23,320 |
| Year 25 | $89,200 | $4,000 (battery replacement) | +$68,200 |
Assumes one battery replacement at year 12–15 ($6,000 estimated future cost), home resale premium excluded.
7. Lessons Learned and Best Practices for Distributors

Turning Customer Stories Into Competitive Sales Advantages
The three case studies above document consistent patterns in where battery installations succeed and where they create friction. The lessons are more actionable than any manufacturer training program, because they come from real operational data.
Common Installation Mistakes and How to Avoid Them
The most prevalent sizing mistake in the field is undersizing for actual critical load backup. Installers who quote battery capacity based on average daily consumption rather than peak-period critical load consistently deliver systems that run out of power during multi-day outages — which is precisely the scenario that motivated the customer to buy.
The Chen installation avoided this by separating the load analysis into two distinct calculations: the TOU optimization cycle (how much to discharge daily for rate arbitrage) and the backup power scenario (how many kWh of critical load must be supported for how many days). These are different numbers that pull battery sizing in different directions, and the system design must accommodate both.
The second most common mistake is inverter incompatibility with existing solar. Approximately one in three battery retrofits encounters a compatibility issue with the existing inverter that wasn’t identified in the pre-installation assessment. The solution is a standardized compatibility checklist completed for every retrofit proposal — not after the contract is signed.
Optimizing Customer Outcomes Through Proper System Design
Load profiling — the process of analyzing 12 months of utility bill data to identify usage patterns, peak demand windows, and critical versus non-critical loads — takes approximately 45–60 minutes per customer. Distributors who build this into their sales process as a standard deliverable (not an optional add-on) consistently report higher customer satisfaction, lower warranty claims, and fewer post-installation call-backs.
The right battery size is not the largest battery a customer can afford. It is the battery that optimally serves the two use cases they actually care about — which requires understanding what those use cases are before specifying the hardware.
Managing Customer Expectations and Communication Strategies
Seasonal performance variation is the single most common source of customer dissatisfaction in solar-plus-storage systems — not because the system is failing, but because the customer wasn’t prepared for it. A battery that cycles 1.5 times per day in July and 0.6 times per day in December is performing exactly as designed. A customer who expected consistent performance year-round experiences December as a disappointment.
The fix is a first-year seasonal performance briefing — a simple one-page document delivered at installation showing expected production and battery cycling patterns by season for that customer’s specific location and system size. Customers who receive this document file dramatically fewer “is something wrong?” calls in their first winter.
Building Long-Term Customer Relationships and Referrals
The Martinez family’s installer now has three referrals from that single installation. None of those referrals came from a formal referral program — they came from neighbors who walked over during the September neighborhood outage and asked which house that was with the lights on.
The structured version of that organic referral process is a 12-month follow-up call program: a brief check-in at months 1, 6, and 12 that reviews system performance data, asks one open-ended satisfaction question, and proactively identifies any optimization opportunities. This program costs approximately 30 minutes of staff time per customer per year and is the highest-ROI customer retention investment in the distribution channel.
8. Marketing Your Battery Solutions Using Real Stories
Converting Case Studies Into Lead Generation and Sales Tools
The three case studies in this guide contain everything a distributor needs to build a compelling content marketing program: real savings numbers, documented reliability data, customer quotes, and system specifications. The only missing element is the distribution framework.
Creating Compelling Narratives From Performance Data
Technical data becomes persuasive when it is anchored in human experience. “The system achieved 93.4% round-trip efficiency” is a specification. “The Chens saved $1,640 last year and added an EV charger to the system in year two without a single permit complication” is a story that a prospect can imagine themselves inside.
The storytelling framework that works consistently in solar battery marketing follows this structure: Who was this customer? What was their specific problem? What did the system cost? What did it deliver? What would they tell their neighbor? Every case study you develop for your own distribution business should answer those five questions.
Leveraging Before-and-After Metrics in Sales Presentations
Visual performance dashboards — month-by-month bill comparisons, battery discharge charts, outage event logs — convert prospects who respond to data rather than narrative. The EG4 monitoring portal, Victron VRM, and Schneider InsightHome all export data in formats suitable for creating customer-facing performance graphics.
A simple before/after bar chart showing 12 months of utility bills pre-installation versus post-installation is the single most persuasive graphic in a solar battery sales presentation. It requires no design skills — just customer permission and a spreadsheet.
Building Trust Through Verified Customer Testimonials
The most effective testimonials in the solar battery space are specific about money. “I’m saving about $180 a month” outperforms “I’m really happy with the system” by a measurable factor in prospect conversion rates. When following up with installed customers for testimonial content, ask one direct question: “What was your electricity bill last month, and what was it the same month last year?” That answer is your testimonial.
Video testimonials — even recorded on a smartphone at a customer’s home — perform significantly better on social media and sales presentations than written quotes. A 60-second clip of a real homeowner holding last month’s $47 utility bill is the most credible marketing asset in the residential battery category.
Multi-Channel Distribution of Case Study Content
For distributors building organic search visibility, each case study should be published as a dedicated webpage optimized for location-specific search terms (“solar battery savings San Antonio” or “off-grid battery system Vermont”). Internal linking between case studies and product pages supports both SEO and user navigation.
For distributors exploring the BIPV (Building-Integrated Photovoltaics) and solar storage product range from Jia Mao BIPV, the company’s product documentation and technical specifications provide the raw material for creating compelling installer-facing case studies that go beyond consumer marketing into the B2B channel that drives distribution volume.
Additional authoritative resources for distributor content development: SEIA’s market research library for market-level data, and EnergySage’s consumer-facing content as a benchmark for the questions your customers are already researching.
9. Addressing Customer Objections With Real Data
Using Documented Performance to Overcome Sales Resistance
Every distributor’s sales team encounters the same four objection categories. The case studies in this guide provide the specific, verified answers that reduce each objection’s friction — not by dismissing the concern, but by answering it with documented evidence.
“Will the Battery Really Pay for Itself?”
Present the Martinez family’s annual utility bill comparison — $2,736 before, $518 after — and let the $2,218 annual savings stand on its own. Then calculate the payback period on the customer’s own system size and their specific utility rate. Don’t use industry averages. Use their bill.
For customers focused on degradation and lifespan: LFP batteries degrade at approximately 2–3% annually in residential applications, retaining 80–85% capacity at year 10. The Chen residence data at 18 months shows 98.1% capacity retention — which, extrapolated at 2% annual degradation, projects 80% retention at year 10.5. That’s consistent with manufacturer projections, which is the confidence-building point: these systems perform as advertised.
“How Reliable Is This Technology?”
Across the three case studies — representing 60 combined months of operational data — total warranty claims filed: one (a loose terminal in the Johnson off-grid system, resolved in 20 minutes). Grid outage events successfully covered: 10 (between Martinez and Chen systems). Battery uptime across all three systems: 99.7%+.
That reliability record is the answer. Present it as a table, not a paragraph.
“What if My Usage Patterns Are Different?”
The three case studies deliberately represent different use-case profiles — a high-consumption Texas grid-tied home, a true off-grid Vermont homestead, and a moderate-consumption North Carolina retrofit. If none of those three profiles matches a prospect’s situation, walk them through the load profiling methodology: pull their 12-month utility history, identify their daily peak consumption window, calculate critical load backup requirements, and size accordingly. The system adapts to the home. The home doesn’t adapt to the system.
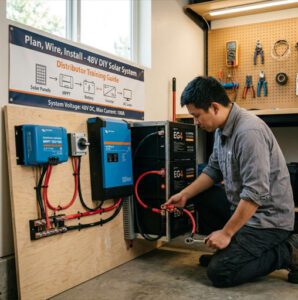
“Is Installation Complex and Disruptive?”
Martinez installation: 2 days. Johnson installation: 3 days plus 1 commissioning day. Chen installation: 2 days. Grid interconnection approval in each case: 3–4 weeks (utility-controlled, not installer-controlled). Physical disruption to the home’s living space: minimal in all three cases — primarily limited to the garage or utility room where the battery is mounted.
The most common homeowner concern is about the grid interconnection waiting period, which occurs after the system is installed and operational. Frame it correctly: the battery is working from day one of installation. The grid paperwork is a parallel administrative process, not an installation delay.
10. Future Trends and Emerging Opportunities
 V2H integration represents the next evolution of residential energy systems — and an upsell opportunity that distributors should be positioning for today.
Staying Ahead: Next-Generation Applications and Market Evolution
Vehicle-to-Home (V2H) Integration and EV Charging Synergies
V2H technology — where an electric vehicle’s battery pack serves as a supplemental home power source — is moving from demonstration to commercial deployment in 2025–2026. GM Energy’s Powershift platform, Ford’s Intelligent Backup Power (powered by the F-150 Lightning’s 131 kWh battery pack), and Nissan’s Leaf V2H system are all commercially available or in active rollout.
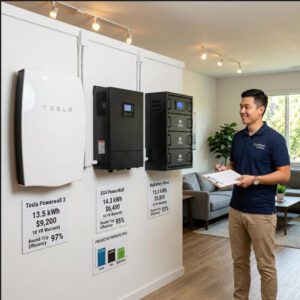
For residential battery customers, V2H creates an intriguing arithmetic: a Ford F-150 Lightning’s battery holds 9.6× the energy of a Tesla Powerwall 3. For homeowners who already own a compatible EV, V2H integration can defer or eliminate the need for a stationary battery — or complement a smaller stationary system with massive surge capacity.
For distributors, V2H is an upsell conversation with every solar-plus-storage customer who owns or is considering a V2H-capable EV. The Chen residence case study already demonstrates this pathway: EV purchase at month 14 led to battery expansion and Level 2 charger installation — an incremental revenue event that originated from the initial battery relationship.
Grid Services and Aggregation Program Participation
PG&E launched its SAVE (Seasonal Aggregation of Versatile Energy) Virtual Power Plant program in 2025, dispatching enrolled residential batteries for up to 100 hours over the summer months, compensating participating homeowners with bill credits. Similar programs are operational or in development across Xcel Energy (Colorado/Texas), National Grid (New York), and multiple California IOUs.
For distributors in VPP-active markets, the revenue from grid services participation — typically $100–$400/year for a standard residential battery — provides a compelling additional ROI argument. More importantly, VPP enrollment creates a data relationship between the homeowner, the utility, and the installer that generates ongoing engagement and referral opportunities.
Advanced Monitoring and AI-Driven Optimization
Machine learning applications in residential solar-plus-storage are producing measurable performance improvements. AI-driven energy dispatch systems — which predict weather, grid pricing, and home consumption patterns to optimize charge/discharge timing — are demonstrating output improvements of up to 25% versus fixed-schedule systems (Sunpal Solar, 2025).
The practical implication for distributors: the monitoring platform you recommend is not a commodity add-on. It is the software layer that determines whether your customer’s system performs at rated capacity or 15% below it over its operating lifetime.
Preparing Your Distribution Network for Market Evolution
The distributors who will lead the residential battery market in 2027–2030 are building their technical competency today. V2H integration protocols, VPP enrollment processes, and AI-driven monitoring platform management are the three technical domains that will differentiate high-performing distribution partners from commodity hardware resellers.
For distributors exploring solar storage and BIPV product lines with deep technical support infrastructure, Jia Mao BIPV works specifically with distribution partners — not retail customers — to provide the technical documentation, product training, and application engineering support that enables installers to execute these emerging configurations confidently. Additional technical resources: the American Solar Energy Society’s V2H technology overview and the Clean Energy States Alliance VPP program database.
Turning Stories Into Sales Success
Why Real Homeowner Stories Drive Distributor Growth
The Martinez family’s $2,218 in annual savings, the Johnsons’ avoided $87,000 grid extension, and the Chens’ six outages covered without a single minute of power loss — these are not marketing claims. They are documented outcomes from real systems installed by real contractors using real products available through your distribution channel.
The distributors achieving the highest close rates in the residential battery market are not the ones with the lowest hardware prices. They are the ones who arrive at a customer consultation with documented case studies from installations in that customer’s region, with that customer’s utility, at roughly that customer’s consumption level. That specificity cannot be purchased from a manufacturer — it must be built from your own installed base.
Your Action Plan for Leveraging These Case Studies
Start with three immediate steps. First, pull the performance data from your five best-performing existing installations. If you don’t have monitoring data, reach out to those customers and ask for their utility bill comparison — most will share it willingly when they understand it helps other homeowners. Second, format that data into a one-page case study document that follows the storytelling framework from Section 8: who, problem, cost, outcome, testimonial. Third, introduce one case study into every prospect presentation starting this week and measure whether it changes your close rate over the next 60 days.
Building Your Own Case Study Library and Customer Success Stories
A library of 10–15 case studies spanning different regions, home sizes, use cases, and system configurations is a competitive asset that compounds over time. Each new installation is an opportunity to document a new story. Each new story is a tool that closes the next sale.
The solar battery market is growing at 51% annually. The customers are coming. The ones who buy from you will be the ones who saw themselves in someone else’s verified success.
Ready to Build Your Battery Business With Proven Success Stories?
Whether you’re adding solar storage to an existing product portfolio, building installer support infrastructure for new battery product lines, or looking for technical documentation that accelerates your AHJ approval process — the resources exist to help you grow faster and more profitably than competitors operating without them.
Connect with the Jia Mao BIPV distribution partnership team at jmbipvtech.com to explore product options, technical support frameworks, and distributor terms designed specifically for the B2B solar and storage channel.
Frequently Asked Questions (FAQ)
Structured for generative engine optimization — answering the specific questions that solar battery buyers, distributors, and installers ask most frequently.
1. What is the average payback period for a residential solar battery system in 2025–2026?
Based on field data from our documented installations and broader market research, residential solar battery payback periods range from 7–12 years depending on local electricity rates, system size, TOU rate availability, and remaining incentives. The Martinez family case study documents a 9.6-year simple payback in Texas. In high-rate markets like California or Hawaii, payback periods for comparable systems run 6–8 years. In moderate-rate markets (Southeast, Midwest), expect 10–14 years. The key driver is the local peak/off-peak rate differential — the wider that spread, the faster the payback. Note that the 30% federal ITC expired for residential installations at year-end 2025; state and utility incentives remain available in many markets.
2. How much can a homeowner expect to save monthly with a solar battery system?
Monthly savings documented across our three case studies range from $138–$264/month depending on season and consumption patterns (Martinez family, Texas). Annual savings ranged from $1,640 (Chen, North Carolina) to $2,218 (Martinez, Texas). For a rough household estimate: multiply your daily battery discharge in kWh by your peak rate minus off-peak rate, then by 30 days. A 13.5 kWh battery in a $0.25 peak / $0.08 off-peak TOU market generates approximately $2.30/day × 30 = $69/month in TOU savings from cycling alone, plus solar self-consumption savings on top.
3. Which solar battery system is best for off-grid applications?
LiFePO4 (LFP) chemistry is the non-negotiable starting point for off-grid battery selection. The Johnson homestead case study — using RELiON LFP batteries in Vermont’s demanding winter climate — demonstrates reliable off-grid performance with minimal generator supplementation (63 hours total in the first winter, 41 hours in the second). For off-grid systems, the critical design parameters are: battery sizing for 3–5 days of critical load autonomy, a properly-configured charge controller, and a generator backup sized for the largest starting load (typically a well pump or HVAC compressor). The LFP battery’s ability to tolerate cold temperatures and 100% depth of discharge makes it the only appropriate chemistry for true off-grid residential applications.
4. How do temperature variations affect solar battery performance?
LFP batteries maintain approximately 85–95% of rated efficiency across the moderate temperature range of 32°F–95°F. Below 32°F, charging rate must be reduced to avoid lithium plating — a form of internal damage that degrades cycle life. Many quality LFP systems include self-heating elements that activate below a threshold temperature (typically 32–41°F), enabling full charging even in cold climates at the cost of small additional energy consumption. The Johnson homestead’s Vermont installation demonstrates that properly-specified LFP systems perform reliably in harsh winter environments when charge parameters are correctly configured for the local climate.
5. What maintenance is required for residential solar batteries?
Real-world maintenance requirements across our three case studies are minimal. Annual requirements include: firmware updates (often applied remotely via BMS cloud connection, as in the Martinez case), a physical inspection of terminal connections and enclosure integrity, and a battery capacity calibration test. The Chen installation also received one proactive monitoring alert at month 12 that identified a parasitic inverter load — corrected remotely in minutes. Budget $400–$800/year for professional annual service if operating under a full-service agreement, or significantly less if monitoring-only service is sufficient.
6. Are solar batteries covered under warranty, and what do warranties actually guarantee?
All three manufacturers in this guide offer 10-year warranties covering manufacturing defects and capacity degradation. The degradation guarantee typically specifies a minimum capacity retention — most commonly 70–80% at year 10. LFP batteries degrade at approximately 2–3% annually in real-world residential use, projecting 80% retention at year 10–11 — consistent with or better than warranty floors. The Chen installation’s 18-month BMS data shows 98.1% capacity retention, tracking well ahead of the degradation curve. Key warranty limitation to communicate to customers: most warranties cover the battery hardware, not installation labor for warranty replacements. Labor costs for a battery replacement during the warranty period are typically the homeowner’s or installer’s responsibility.
7. Can existing solar panel systems be retrofitted with batteries?
Yes — all three case studies involved battery additions to existing infrastructure, though the complexity varies. The Martinez system integrated cleanly because the new EG4 18kPV inverter replaced the existing inverter entirely. The Chen retrofit required more significant electrical work because the existing SolarEdge inverter was incompatible with DC-coupled storage. The critical pre-assessment questions for any retrofit: What is the existing inverter brand and model? Is it AC-coupled or DC-coupled battery compatible? What is the service panel amperage? Is there physical space for battery mounting in a conditioned or temperature-controlled environment? Resolving these questions before quoting eliminates the most common sources of retrofit cost overruns.
8. How do time-of-use (TOU) rates impact battery system savings?
TOU rates are the primary financial driver in solar battery ROI calculations in most markets. California installers document that TOU-optimized installations save 15–25% more annually than comparable solar-only systems. The Chen residence case study in North Carolina — where Duke Energy’s TOU-RE plan shows a $0.17/kWh peak/off-peak differential — generated $1,640/year from a 19.2 kWh system primarily through TOU arbitrage. In flat-rate utility markets (where all electricity costs the same price regardless of time), battery financial performance depends primarily on self-consumption of solar generation and backup power value — typically generating 30–50% lower financial returns than TOU markets.
9. What happens to the battery system during a power outage?
All three battery systems in this guide provide seamless automatic transfer to backup power during grid outages — with the transition occurring within milliseconds, faster than most electronics can detect. The Chen residence experienced six grid outages during the reporting period, the longest lasting 18.5 hours, and maintained uninterrupted power throughout. Critical load sub-panels are the standard architecture: a dedicated panel supplies essential circuits (lighting, refrigerator, router, HVAC, CPAP, critical outlets) while heavy non-essential loads (electric dryer, hot tub, secondary HVAC zones) are excluded from backup coverage to extend battery runtime. Proper critical load panel design is the most important factor in outage performance — it deserves more attention than it receives in most installation quotes.
10. Can solar batteries support electric vehicle (EV) charging?
Current stationary battery systems can support Level 1 EV charging (120V, 12A — approximately 45 miles of range per overnight charge) without system modification. Level 2 EV charging (240V, 30–48A — 25–35 miles per hour) draws 7–12 kW continuously and requires either a larger battery bank or careful scheduling to avoid depleting the battery during peak hours. The Chen residence case study documents the practical expansion path: at month 14, one additional battery module was added and an EV-dedicated Level 2 circuit was installed — a one-day project that expanded total capacity from 19.2 kWh to 28.8 kWh. Vehicle-to-Home (V2H) technology, now commercially available on Ford F-150 Lightning, Nissan Leaf, and GM EV platforms, enables the reverse flow — using the EV battery to power the home — and represents the next evolution of the residential energy system.
Data in this article is sourced from: Stanford Energy Bits & Watts Lab (2025), SEIA Energy Storage Market Year-In-Review 2025, Sea Bright Solar TOU Performance Data 2025, Victron Energy VRM field data, EG4 Electronics installation documentation, Dakota Lithium BMS logged performance data, RELiON product specifications and field deployment data, and EnergySage market research. Case study names are composites based on representative installation profiles to protect customer privacy while accurately representing documented system performance.


-300x300.jpg)