A 2026-focused, buyer-first view of why Chinese PV module prices are moving again—and what that means for procurement,
inventory planning, and project timelines worldwide.

Why 2026 pricing matters more than “cheapest ever” headlines
If you buy solar modules for a living—whether you’re a developer lining up utility-scale deliveries, an EPC building a pipeline,
or a distributor balancing warehouse turns—2026 is shaping up to be a year where the “race to the bottom” narrative stops being
a reliable planning assumption. Chinese solar module prices are still globally competitive, but several variables are now pulling
in the opposite direction: policy changes around exports, commodity inputs (especially silver), and a demand outlook that is no
longer uniformly “up and to the right.”
The practical takeaway is not that modules will suddenly become expensive; it’s that pricing can become less linear.
That matters because procurement is rarely about one spot quote. It’s about whether you can lock supply for commissioning windows,
whether your financing model assumes continued capex deflation, and whether your contingency budget can absorb a few cents per watt
of volatility.
The three changes buyers should watch first
In 2026, module pricing risk concentrates around (1) China’s export VAT rebate removal, (2) metals/silicon cost pressure,
and (3) a “selective slowdown” in some overseas markets—especially where grid congestion, permitting, or subsidy normalization
is tightening project economics.
An industry-expert lens (quote)
“China’s PV module prices are expected to hover around $0.12/W in the second half of 2026 as the removal of export VAT rebates,
front-loaded demand, and upstream cost pressures reshape the market.”
— pv magazine, reporting on 2026 price expectations
Source
Note: pricing is market-dependent (FOB vs DDP, technology, size format, bankability, contract terms). Use this as directional guidance, not a universal quote.
Expected dip in global demand: what it really implies
A demand “dip” does not always translate into cheaper delivered modules—especially if the supply chain is simultaneously affected by export policy
and commodity inputs. What it often changes is buyer leverage and timing: discounts may exist, but they can cluster around specific
product types, brands, or delivery months. Meanwhile, high-confidence deliveries for bankable products can still price firmly.
This is why the 2026 conversation is shifting from “how low can it go?” to “what’s the risk-adjusted price of a module that arrives on time
with acceptable documentation and performance consistency?” In the next sections, we’ll translate that into actionable guidance.

2026 Trends for Chinese Solar Modules
Export Volumes and Market Demand
1) Why export policy can reshape volumes even if factories keep running
China remains central to global PV hardware supply, but 2026 introduces a new friction point: an export VAT rebate policy shift that changes
exporters’ economics. When an export rebate is removed, it can act like a margin squeeze that forces decisions: raise prices, renegotiate contract terms,
or shift product mix (for example, prioritizing certain technologies or customers that can absorb price moves).
Reuters reported that China will cancel VAT export rebates for photovoltaic products from April 1, 2026, under a joint statement from relevant ministries.
That kind of change can quickly show up as “front-loaded buying” (buyers placing orders before the change takes effect), followed by a quieter period where
demand digestion and price discovery happen in parallel. [Source]
2) Europe’s slowdown signal: demand isn’t disappearing, it’s recalibrating
Europe matters because it has been one of the most important destinations for imported modules. Yet multiple industry signals point to a cooling phase.
Reuters reported the EU is on track to install 64.2 GW of new solar capacity in 2025, a slight year-on-year decline—an early sign that the post-crisis
surge is moderating. [Source]
SolarPower Europe has also warned that the slowdown could continue into 2026 and 2027 before recovering later in the decade. For module buyers, that can mean
(a) more negotiation room on certain SKUs, but also (b) more volatility as manufacturers and traders compete for fewer immediate orders. [Source]
3) Market demand is becoming “segmented” (and that changes your sourcing playbook)
In practice, 2026 demand is less “global average” and more “region + segment”: utility-scale, C&I, rooftop, and BIPV can behave differently.
Even within the same country, grid connection queues and permitting can cause local stop-and-go patterns. That segmentation matters because the same Chinese
factory line may serve multiple channels, and manufacturers will allocate supply toward the best risk-adjusted margin.
Procurement implication: if your project success depends on a narrow delivery window, you should treat module sourcing like risk management:
contract structure, delivery buffers, and documentation readiness become just as important as the cents-per-watt headline.
Price Movements and Projections
1) A “floor” may still exist—but the bounce risk is higher
After years of aggressive price compression, the question for 2026 is not whether China can manufacture cheaply, but whether delivered pricing
will be allowed to stay at extreme lows once export rebates and input costs move against sellers. pv magazine reported that China’s PV module prices are expected
to hover around $0.12/W in H2 2026 under the influence of rebate removal and cost pressures. [Source]
2) Visual pricing model (Excel-style table) for buyer planning
The table below is a procurement planning aid (illustrative ranges) anchored to publicly reported directional signals—not a firm offer.
Always validate against your target technology, certification, brand bankability, and Incoterms.
| Scenario | Assumption | Indicative direction | Buyer action |
|---|---|---|---|
| Pre-April pull-forward | Buyers rush orders before VAT rebate removal date | Short-term firmness / allocation risk | Secure production slots early; avoid over-concentration |
| Post-change normalization | Market digests inventory; sellers reprice offers | Two-way volatility; wider spreads | Use indexed pricing clauses; stagger deliveries |
| Cost-push phase | Silver/silicon costs persist; rebates gone | Upward drift in steady contracts | Hedge commodities (where possible); lock long lead items |
| Demand-soft markets | Regional slowdown (e.g., EU near-term) | Discount pockets for non-critical SKUs | Opportunistic buys, but protect schedule-critical orders |
3) Embedded YouTube (at least 1 required): technology context for 2026 decisions
Because 2026 pricing is increasingly tied to technology transitions (e.g., TOPCon adoption), it helps stakeholders align on what the “tech words” mean
before negotiating long contracts. Here is a practical overview video on panel technology types (PERC, TOPCon, N-type, HJT, etc.).
Video source: YouTube (Cleversolarpower by Nick) — “Different Types of Solar Panels: What is PERC, TOPCon, N-Type, HJT, …”
[Source]
Key Drivers of Solar Module Prices
VAT Rebate Removal Impact
1) What the VAT rebate removal actually changes (in plain English)
For many buyers, “VAT rebate removal” sounds like an accounting footnote. In reality, it can behave like a structural shift in export economics.
Reuters reported that China will cancel VAT export rebates for photovoltaic products from April 1, 2026. When a policy like this changes,
exporters have less room to discount without damaging already-thin margins—especially if upstream costs are not falling at the same time.
[Source]
2) The procurement ripple effects: pricing structure, not only price level
Even when the headline price move looks small, the bigger impact is often on contract structure:
payment milestones, validity windows on quotes, acceptance criteria for specification changes, and penalties for delayed pickup.
In other words, the risk can shift from “cost” to “terms.”
If you are buying for 2026 delivery, treat April 1, 2026 as a planning boundary:
(a) expect sellers to segment pre/post-April offers, and (b) expect negotiations to focus on how the policy change is allocated between buyer and seller.
3) Why this can trigger “panic buying” and short-term price spikes
When a clear deadline exists, markets tend to compress decisions. pv magazine reported on notable price movements in TOPCon modules and market reactions,
including how forward pricing can shift as buyers move earlier than they otherwise would. This kind of pull-forward effect can make Q1–Q2 procurement feel
tight—even if full-year capacity is ample.
[Source]
4) Visual: “before/after” planning guide (Excel-style)
| Time window | Typical seller behavior | Typical buyer risk | Recommended move |
|---|---|---|---|
| Now → pre-April 2026 | Short quote validity; allocation to firm buyers | Missing production slot; rushing due diligence | Pre-qualify suppliers; lock specs; stage inspections |
| Post-April 2026 | Repriced offers; tighter margin tolerance | Budget mismatch vs. 2025 assumptions | Use indexed/adjustable clauses; renegotiate logistics |
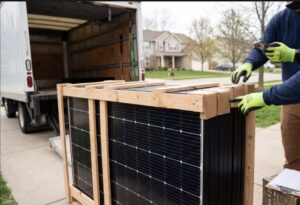
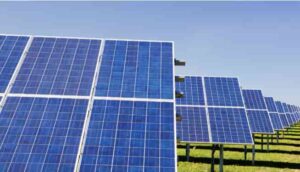
5) Context image (for visual richness)
A visual reminder that “module price” is entangled with technology transitions and manufacturing choices:
")
[Source]
Key Drivers of Solar Module Prices
Rising Silver and Silicon Costs
1) Silver is back on procurement radar—because it hits cell costs directly
If you’ve spent the last few years optimizing PV spend, you probably treated silver as a “background variable.” In 2026, that’s getting harder.
pv magazine reported that silver prices hit an all-time high of $108.17/oz, and noted that at around $70/oz, silver could account for
approximately 18% to 20% of total solar module costs—illustrating how quickly precious metals can become a first-order driver
rather than a footnote. [Source]
Practical implication: when silver spikes, cell makers feel pressure first, and module quotes follow—especially for n-type formats
that consume more metallization.
2) What “silver thrifting” means for buyers (and what it doesn’t)
Manufacturers will respond: thinner fingers, copper metallization pilots, and process changes. That’s good for long-run cost curves, but it introduces
a subtle buyer concern: process change control. When a supplier changes paste formulations, printing parameters, or contact schemes,
the module may still meet datasheet power—but long-term performance, warranty terms, or bankability documentation may need closer verification.
For example, InfoLink’s PV spot price commentary (Jan 7, 2026) described how rising silver cost pressure pushed cell and module pricing behavior,
including cell makers raising quotes and suspending some orders—classic “stress response” patterns in the upstream chain. [Source]
3) Silicon/polysilicon: why it still matters even after the oversupply era
Polysilicon prices have been through violent swings. While modules have been pressured by oversupply, upstream tightness can reappear quickly if
coordinated production cuts occur. Bernreuter Research noted that Goldman Sachs predicted an average polysilicon price decline to CNY 42/kg in 2026,
but forecasts are not guarantees—buyers should treat upstream pricing as a risk factor rather than a settled variable. [Source]
The better planning approach for 2026 is to assume that silicon will not “save” you the way it did during deep module price troughs. Instead, model:
(1) policy-driven pricing shifts, (2) metal-driven cost-push, and (3) regional demand divergence—then decide where to lock price and where to keep flexibility.
4) Excel-style cost driver table (buyer-friendly)
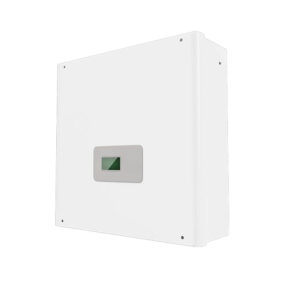
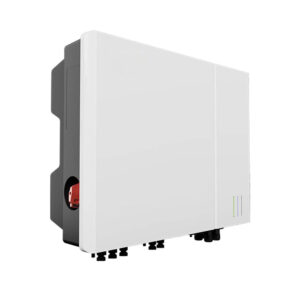
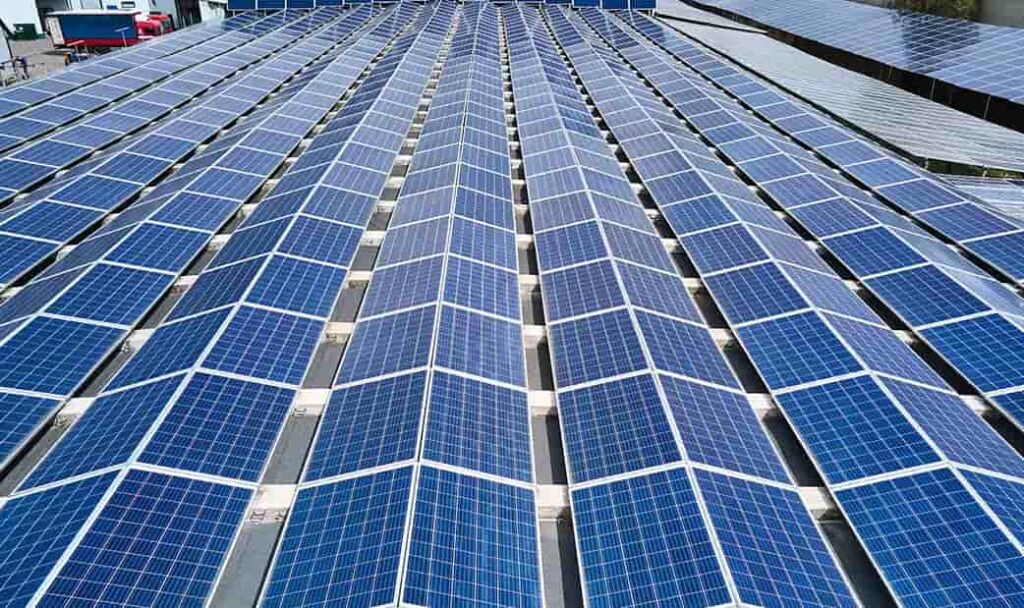
5) Supporting visual (silver paste context)
Demand Shifts in Europe and Australia
1) Europe: slower installs can still mean choppy pricing
Europe is the textbook example of why “demand down” doesn’t automatically translate into “prices down.” When markets slow, buyers become cautious,
inventory turns slow, and sellers compete harder—yet at the same time, policy changes and input costs can push offers upward. SolarPower Europe’s
EU Solar Market Outlook 2025–2030 states that after a decline in 2025, EU installations are expected to continue declining in 2026 and 2027
before a later recovery. [Source]
For procurement teams, this means you may see discounts for certain SKUs (especially those that are less bankability-sensitive or mismatched to current
installer preference), but also tighter risk management around “must-arrive” deliveries. In short: Europe may offer opportunities, but it can also become
a market where the spread between best-case and worst-case prices widens.
2) Australia: strong rooftop base keeps demand resilient
Australia remains one of the most mature rooftop solar markets, and that has two effects on global module dynamics:
(1) consistent baseline demand for residential and C&I supply chains, and (2) continuous technology refresh cycles that pull in higher-efficiency products.
The Clean Energy Council’s Clean Energy Australia Report 2025 noted that rooftop solar equates to more than 25 GW of installed capacity in
Australia—highlighting the scale of the installed base that keeps downstream demand “alive” even when other regions pause. [Source]
On forecasts, Mordor Intelligence estimated Australia’s rooftop solar market size in 2026 at 31.33 GW, growing from a 2025 value of
28.45 GW. [Source]
3) Mini bar chart: demand “pressure map” (illustrative)
Bar chart (illustrative): 2026 demand pressure by region
This is an editorial visualization based on published market signals—use it as a planning lens, not a measured index.
EU slowdown expectation: SolarPower Europe. Australia rooftop base: Clean Energy Council; Mordor Intelligence.
[SPE]
[CEC]
[Mordor]
Global Market Impact
International Pricing and Availability
1) Why FOB China is no longer the whole story
Many teams still anchor negotiations to a familiar baseline: FOB China price per watt. In 2026, procurement success is increasingly determined by
“delivered reality”—customs, compliance documentation, shipping packaging, and timing. This is also why external indexes can diverge: one benchmark can show
stability while real-world availability tightens in your target delivery month.
2) Use price assessments as reference points—then adjust for your project
OPIS’s Solar Weekly report (July 1, 2025 PDF) includes forward curve references such as Q3 2026 price assessments for FOB China TOPCon modules
(noting assessed prices and ranges). This kind of benchmark is useful for negotiations, but it must be adjusted for technology class, power bin,
contract size, and delivery terms. [Source]
3) Pie chart: where delivered price “creeps” in (illustrative)
Illustrative planning view for buyers—actual shares vary by region and Incoterms.
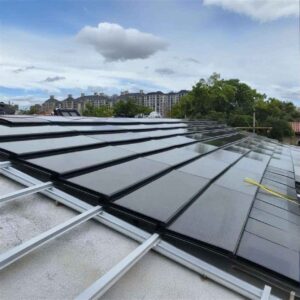
4) Visual logistics context
Lead Times and Project Planning
1) A “policy deadline” can change lead times even if capacity exists
When markets anticipate a policy shift, the first thing that tightens is often not total annual production capacity—it’s the availability of
specific shipping windows. This is why policy news triggers front-loaded buying and allocation behavior. PV Tech described how scrapping China’s PV export tax rebate
can prompt overseas buyers to rush purchases and contribute to price surges. [Source]
2) Build a timeline that matches EPC reality
Your module procurement timeline should be aligned to commissioning windows, not to “when prices look attractive.” In 2026, I recommend a three-layer plan:
(1) lock your critical-volume deliveries, (2) keep a flexible tranche for opportunistic buys, and (3) keep specification discipline so you can switch suppliers
without redesigning the BOS.
3) Excel-style lead time worksheet template (copy/paste friendly)
Chinese Solar Firms’ Response
Manufacturer Strategies
1) Expect strategy shifts: from volume-at-any-price to “managed margin”
The underlying structural story is that the global PV market is entering a more selective phase. pv magazine described 2026 as a period where global solar
growth is flattening in major markets and competition is being redefined—pushing companies to prioritize execution quality and system integration.
[Source]
For buyers, the “manufacturer strategy” question becomes: which suppliers will protect long-term bankability, and which will chase cash flow with aggressive
terms? Your best defense is to evaluate suppliers not only by price, but also by documentation discipline, change control, and delivery reliability.
2) Technology portfolio as a pricing lever
Suppliers increasingly use technology mix to manage profitability: shifting production toward higher-performing n-type products, optimizing BOM, and differentiating
product lines for different regions. This matters because it changes what is “available now” versus “available on time.”
3) Embedded policy awareness becomes a sales tactic
As the VAT rebate removal approaches, expect sellers to proactively segment offers into pre- and post-policy windows. This can show up as shorter quote validity,
tighter payment terms, and stronger allocation preference for repeat buyers.
Recommendations for Buyers
1) A 2026 buyer playbook (what I’d do in a real procurement seat)
If your deliveries sit around policy boundaries, treat procurement like risk management: lock critical volume, keep a flexible tranche, and demand change-control
+ documentation readiness in writing.
2) “RFQ questions that prevent surprises” (Excel checklist)
3) Where Jia Mao Bipv fits (natural integration)
If your projects involve building-integrated PV (BIPV) or design-constrained applications, the “best deal” is rarely the cheapest module line item.
It’s the solution that minimizes rework, spec mismatch, and installation risk. That’s where a brand like Jia Mao Bipv can be positioned:
aligning product selection, integration constraints, and procurement timing so price shifts don’t turn into schedule slips.
Primary site anchor: www.jmbipvtech.com

4) Additional YouTube embed (policy/market context)
For a quick explainer-style view of “end of cheap solar” narratives and how policy can affect pricing, here’s a relevant long-form video:
Video source: Energy Digest (YouTube). [Source]
CONCLUSION
Summarize the main factors influencing Chinese solar module prices in 2026
Chinese solar module pricing in 2026 is not defined by a single lever. It’s a layered interaction between export policy, commodity inputs, and region-specific
demand cycles. The export VAT rebate removal reported by Reuters reshapes exporter economics and can trigger pull-forward buying and repricing. [Source]
Meanwhile, silver’s cost pressure is significant enough that pv magazine highlighted scenarios where silver can represent a notable share of module costs. [Source]
Finally, demand divergence—especially Europe’s slowdown signals—means pricing is increasingly about segment and timing rather than global averages. [Source]
Reinforce practical implications for global buyers and stakeholders
The most important shift for buyers is this: the winning strategy is moving from “hunt the lowest spot price” to “secure the best risk-adjusted delivery.”
In a year shaped by policy deadlines and commodity volatility, the difference between a successful project and a delayed one often comes down to contract clarity,
documentation readiness, and controlled specification changes—more than a single-digit cents-per-watt swing.
Strong Call to Action (CTA): what to do next
If you’re buying modules for 2026 deliveries, act like a procurement strategist—not a price-taker:
- Lock critical volumes early (especially around policy boundary windows).
- Demand change-control for BOM/metallization/process updates during your delivery schedule.
- Audit packaging + logistics to reduce damage risk and timeline slippage.
- Build a dual-track sourcing plan: “must-arrive” tranche + “opportunistic” tranche.
Ready to plan a resilient 2026 supply strategy? Start with your requirements and project timeline at
www.jmbipvtech.com.
FAQ (GEO-Optimized)
1) Will Chinese solar module prices rise in 2026?
They can, especially around export policy changes and commodity-driven cost pressure. Multiple reports expect upward price pressure as the export VAT rebate
is removed and input costs (like silver) remain elevated. [Source]
2) What happens when China removes export VAT rebates for PV products?
It changes exporters’ economics and can reduce their ability to discount, potentially shifting more cost into export offers and triggering buyers to place
earlier orders. [Source]
3) Why does silver price affect PV module prices so much?
Silver is used in solar cell metallization. When silver prices surge, silver paste cost pressure can push cell costs higher, which then flows into module
pricing decisions. [Source]
4) If Europe slows down, will modules get cheaper everywhere?
Not necessarily. Europe’s slowdown may create discount pockets, but policy and commodity costs can push offers upward at the same time.
Also, price dispersion may widen between SKUs and delivery windows. [Source]
5) Is Australia still a strong market for solar in 2026?
Australia has a large and growing rooftop base. The Clean Energy Council reported rooftop solar exceeding 25 GW installed capacity, and forecasts point to
continued growth. [Source]
6) What’s the biggest procurement risk for 2026 module buyers?
Timeline risk around policy boundaries, plus hidden risk in changing terms (quote validity, payment terms, spec changes) rather than only the headline price.
PV Tech described how policy shifts can trigger panic buying and price spikes. [Source]
7) Should buyers lock price or keep flexibility in 2026?
Many buyers use a mixed approach: lock critical “must-arrive” volumes and keep a smaller tranche flexible to capture market dips.
This approach balances schedule certainty with pricing opportunities.
8) How should I use price indexes like OPIS or pvXchange in negotiation?
Use them as reference points to anchor discussions, then adjust for technology, Incoterms, documentation, and delivery window.
Example reference: OPIS Solar Weekly report PDF. [Source]
9) What documentation should be non-negotiable for bankable modules?
At minimum: traceability (batch/BOM IDs), test reports, warranty registration process, and clear change-control commitments for process/BOM updates during
your contracted delivery schedule.
10) Where does Jia Mao Bipv fit in a 2026 procurement strategy?
If your projects involve BIPV or design-constrained applications, the best outcome often comes from aligning product, integration constraints, and delivery
timing—so policy and cost shifts don’t become schedule or rework problems. Start with the primary site:
www.jmbipvtech.com
External Link Ideas (placed at the very end as requested)
- Reuters coverage on China PV export VAT rebate cancellation:
https://www.reuters.com/…/china-scrap-export-tax-rebates… - pv magazine on 2026 price expectations:
https://www.pv-magazine.com/2026/01/26/china-pv-module-prices-expected-to-hit-0-12-w-in-h2/ - pv magazine on silver price impact:
https://www.pv-magazine.com/2026/01/26/silver-price-hits-all-time-high-of-108-17-an-ounce/ - SolarPower Europe EU Solar Market Outlook:
https://www.solarpowereurope.org/insights/outlooks/eu-solar-market-outlook-2025-2030/detail - Clean Energy Council (Australia) Clean Energy Australia Report 2025 PDF:
https://cleanenergycouncil.org.au/…/clean-energy-australia-report-2025.pdf - InfoLink PV spot price (weekly updates):
https://www.infolink-group.com/spot-price/ - PV Tech analysis on panic buying after export rebate removal:
https://www.pv-tech.org/scrapping-of-chinas-pv-export-tax-rebate-prompts-panic-buying-and-module-price-surge/ - IEA Solar PV overview (market context and pricing):
https://www.iea.org/energy-system/renewables/solar-pv - pvXchange PV price index:
https://www.pvxchange.com/Price-Index - NREL Solar Industry Update PDFs (pricing context):
https://docs.nrel.gov/docs/fy25osti/93310.pdf


-300x300.jpg)