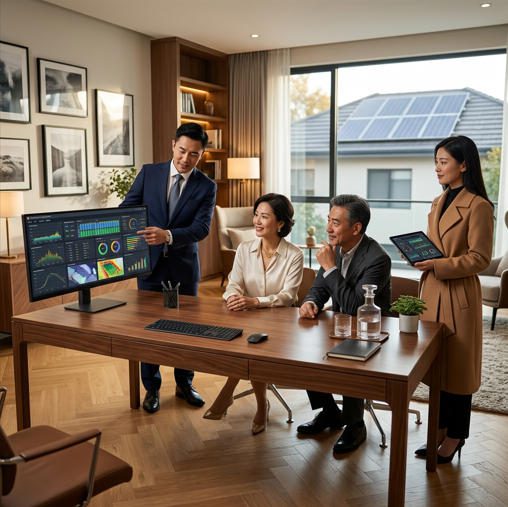
A complete distributor’s guide to microinverter monitoring systems — empower your sales team, educate your customers, and turn data into closed deals.
Real-time panel-level data gives homeowners — and their distributors — a live window into exactly how every panel is performing, right now.
Here is a situation every solar distributor recognizes: a customer asks, “How do I know my panels are actually working properly?” If the answer is “the utility bill went down,” that customer is not confident — they are hoping. Panel-level monitoring transforms that dynamic entirely. It replaces hope with data, and data is what builds the kind of customer trust that generates referrals.
Understanding panel-level monitoring is no longer optional for distributors and agents who want to compete in the premium residential and commercial solar markets. The global solar monitoring system market was valued at $1.26 billion in 2025 and is projected to more than double to $3.26 billion by 2034 (The Insight Partners). The shift toward module-level intelligence is accelerating — and the distributors who master it first own the premium tier of the market.
This guide walks through everything your sales team needs to know: what the data actually shows, how to explain it to non-technical customers, how to use it to justify the microinverter premium, and what the next generation of monitoring technology will look like. Jia Mao BIPV has compiled this resource from field experience, platform analysis, and the latest market data — so your team can walk into any customer conversation ready.
1. Understanding Microinverter Monitoring: The Foundation
What Is Panel-Level Monitoring?
Panel-level monitoring — sometimes called module-level monitoring or MLPE monitoring (MLPE = Module-Level Power Electronics) — is the ability to track the performance of each individual solar panel independently and in real time. Unlike system-level monitoring, which reports total array output as a single number, panel-level monitoring gives you a separate data stream for every single panel on the roof.
The mechanism is straightforward: each microinverter (a compact inverter mounted directly behind each panel) converts the panel’s DC electricity to AC at the source, and simultaneously records and transmits performance data — wattage, voltage, current, temperature, and operating status — to a cloud-based monitoring platform. That data is accessible via a web dashboard or smartphone app, updated as frequently as every 5 minutes on most platforms and every 30 seconds on premium systems.
How Microinverters Differ from String Inverters in Monitoring
The monitoring difference between these two architectures is not just technical — it is commercial. A string inverter tells you how much electricity your entire roof produced today. A microinverter system tells you how much electricity each of the 24 panels on your roof produced — every five minutes, all day, accessible from your phone while you are at work.
For distributors, this distinction is critical when explaining system advantages to price-conscious customers. The question to ask is not “do you want monitoring?” — it is “when something goes wrong with one panel, do you want to know about it today or in six months when your electricity bill is mysteriously higher?”

Panel-level monitoring platforms display individual performance metrics per panel — a fundamentally different level of visibility than string inverter aggregate data.
Why Real-Time Data Matters for Your Customers
Real-time data serves three commercial functions that distributors should communicate in every sales presentation:
Immediate problem detection. When a panel underperforms due to shading, soiling, or equipment failure, the monitoring platform flags it within minutes. In a string inverter system, the same issue may reduce output silently for weeks before it is noticeable on an electricity bill.
Customer engagement and confidence. Homeowners who check their monitoring app regularly — and surveys show most microinverter owners do — feel actively connected to their investment. That engagement reduces post-sale anxiety, decreases support calls, and creates the kind of satisfied customers who recommend your company to neighbours without being asked.
Data-driven maintenance decisions. Rather than scheduling cleaning and inspections on a calendar, customers can schedule maintenance when data shows it is needed — optimizing the investment in upkeep rather than spending money on arbitrary schedules.
2. Core Monitoring Metrics: What Data Your Customers Can See
When a customer asks “what does the monitoring actually show me?” — this is the answer your team needs to deliver clearly and confidently. There are four core data streams that every microinverter monitoring platform provides.
Real-Time Power Output per Panel
Each panel’s instantaneous wattage output is the headline metric. On a clear afternoon, a healthy 400W panel might be showing 380–400W of output. A panel with bird dropping soiling might show 310W. A panel in partial shade from a chimney might show 180W. These numbers appear as a live visual map of the roof layout — each panel color-coded by its current performance relative to expected output.
For distributors, emphasize that this visibility prevents “hidden problems.” In a string inverter system, that 180W panel is dragging the output of all 12 panels in its string — but there is no alert, no visual indicator, and no way to know without a technician visit. In a microinverter system, the homeowner’s phone shows a yellow panel on the roof map by 10:00 AM.
Voltage and Current Measurements
Voltage and current data at the panel level are diagnostic tools that most homeowners will not interpret directly — but their installers and support teams will. Voltage dropping below expected parameters can indicate a failing microinverter connection, wiring degradation, or panel defect. Current imbalances can signal shading patterns that were not captured during the site assessment. These data points allow remote diagnosis before dispatching a technician, saving time and reducing service costs for installer networks.
Temperature Monitoring and Thermal Performance
This is one of the most under-explained features in distributor sales presentations — and one of the most useful for customer education, particularly in hot climates.
Solar panels are rated at standard test conditions of 25°C. For every degree Celsius above that, most crystalline silicon panels lose 0.3% to 0.5% of their rated output — a figure called the temperature coefficient. On a hot summer roof where panel surface temperatures reach 65°C (40°C above STC), a panel with a -0.4%/°C coefficient is operating at approximately 84% of its rated power. That is 64W of loss on a 400W panel — from temperature alone, before any shading or soiling.
Performance Ratio Tracking
Performance Ratio (PR) is the ratio of a system’s actual electricity output to what it would have produced under ideal conditions for the same amount of sunlight. A PR of 0.82 means the system is delivering 82% of its theoretical maximum — with the remaining 18% lost to temperature, shading, wiring resistance, inverter efficiency, and other real-world factors.
Panel-level PR data lets installers and distributors identify whether a performance gap is system-wide (weather-related, expected) or localized to specific panels (equipment or maintenance issue). Healthy residential systems typically achieve PR values of 0.75–0.85. When panel-level data shows a single panel running at PR 0.55 while all others are at 0.82, there is a diagnosable problem — and panel-level monitoring found it automatically.
3. Performance Optimization Features: Actionable Insights

Field technicians equipped with panel-level monitoring data can identify shading issues, soiling patterns, and equipment anomalies remotely — before dispatching for a site visit.
Identifying Shading and Obstructions
Shading analysis is where panel-level monitoring delivers some of its most commercially persuasive value — and where it can directly influence system design decisions before a single panel is installed.
When a new system goes live, monitoring data from the first few weeks creates a production fingerprint for every panel. Panels that consistently underperform relative to their neighbors reveal shading patterns that may not have been fully captured in the pre-installation site assessment. A chimney that casts shade between 9–10 AM, a neighbor’s new fence, or a satellite dish that was not noted during the site walk — all of these appear as persistent underperformance patterns in panel-specific data.
2025 field data from shaded and complex rooftops shows that panel-level systems recover 5–15% more annual energy than string-level alternatives in comparable conditions (Sunpal/NREL analysis, 2025). For a 10 kW system producing 14,000 kWh/year, a 10% recovery represents 1,400 kWh annually — approximately $196 per year at $0.14/kWh electricity rates.
Performance Ratio Tracking and Soiling Alerts
Soiling — the accumulation of dust, pollen, bird droppings, and air pollution particulates on panel surfaces — is one of the most underappreciated performance thieves in residential solar. Research published in the Applied Energy journal and IEA PVPS Task 13 reports documents soiling losses of 1–35% of annual output depending on climate, panel orientation, and cleaning frequency.
Panel-level monitoring detects soiling through a specific signature: multiple adjacent panels showing similar, gradual output decline relative to expected PR, with the pattern worsening during dry or windy periods and recovering after rainfall. This is distinct from shading (which follows time-of-day patterns) and equipment failure (which affects a single panel sharply). When monitoring data shows this pattern, it triggers a cleaning recommendation — not based on a calendar, but based on actual measured impact on output.
Efficiency Trends and Predictive Analytics
Advanced monitoring platforms — particularly those from Enphase, APsystems, and SolarEdge — now incorporate machine learning algorithms that analyze months of historical panel performance to identify emerging degradation patterns before they become failures. A microinverter that is showing gradual, non-weather-correlated output decline over 60 days is statistically likely to fail within the next 30–90 days. Predictive algorithms flag this for proactive replacement before the customer ever notices reduced production.
This capability is transforming the economics of solar O&M. As noted by the World Economic Forum in their 2024 analysis of AI in solar, predictive analytics for solar systems can reduce unplanned downtime by 30–40% — a figure that translates directly to higher annual energy production and lower maintenance costs for end customers.
4. The Monitoring Dashboard: What Distributors Need to Explain
User-Friendly Interface Design
The monitoring dashboard is the customer’s daily interface with their solar investment — and it needs to be intuitive enough that a non-technical homeowner can understand it at a glance. Leading platforms have invested heavily in this: Enphase Enlighten presents a visual roof map where each panel is color-coded by relative performance. APsystems’ EMA platform displays module-level data in a sortable grid. SolarEdge’s mySolarEdge app shows a timeline of production by panel throughout the day.
For distributors, the ability to demo these platforms during the sales process is a powerful closing tool. Showing a prospect their simulated roof map on a tablet — with each panel showing its expected daily output — transforms an abstract technical discussion into a concrete, tangible customer experience.
Leading Monitoring Platforms: A Quick Comparison for Distributors
| Platform | Update Frequency | Panel-Level Granularity | Mobile App | Installer Portal | Best For |
|---|---|---|---|---|---|
| Enphase Enlighten | Every 5 min (15 min on older systems) | Full per-panel | iOS & Android | ✅ Enlighten Manager | Residential premium |
| APsystems EMA | Every 5 min | Full per-panel | iOS & Android | ✅ EMA Pro | Residential & small C&I |
| SolarEdge mySolarEdge | Every 15 min | Per-optimizer (panel-level) | iOS & Android | ✅ Monitoring Portal | Residential & C&I |
| Hoymiles S-Miles Cloud | Every 15 min | Full per-panel | iOS & Android | ✅ Installer Portal | Value residential |
Mobile App Accessibility
The smartphone app is the feature that customers talk about most in post-installation surveys — more than efficiency ratings, more than warranty length, more than aesthetics. Why? Because it makes the invisible visible. Electricity generation is abstract until you can watch the number going up in real time on a sunny afternoon.
Distributors should build the app experience into the sales presentation. Showing a prospective customer the app on your own phone — scrolling through a real installation’s daily production chart, pointing out the dip at noon from chimney shading, then the recovery as the sun moved — is worth more than any brochure. It makes the monitoring feature tangible in 60 seconds.
Customizable Alerts and Notifications
Most platforms allow customers to set performance thresholds — “alert me when any panel produces less than 70% of its expected output for more than 30 minutes.” When that threshold is crossed, a push notification hits their phone within minutes. This proactive alert system means customers discover problems faster than they would by waiting for an unusually high electricity bill — often catching issues days or weeks earlier.
For installer networks, this alert system also enables proactive service contracts. Distributors who maintain installer portal access (with customer permission) can monitor dozens of systems simultaneously and dispatch service before customers even know there is a problem. This is the foundation of a recurring revenue maintenance model.
5. Troubleshooting and Diagnostics: Solving Customer Problems
Detecting Equipment Failures
Equipment failure detection is where panel-level monitoring delivers its most economically decisive advantage over string inverter systems. When a microinverter fails in a string inverter system, there is no direct indication. The monitoring platform shows slightly lower total output — but since output varies daily with weather, a 3–4% drop from a single failed unit in a 20-panel system may not trigger any alert for weeks or months.
In a microinverter system, a failed unit shows as zero output from a specific panel, flagged within minutes of the failure occurring. The monitoring platform sends an alert, identifies the exact panel by roof position, and logs the fault code. A trained technician can often diagnose the failure remotely — confirming it is a microinverter failure rather than a panel defect or wiring issue — before ordering the replacement part and scheduling the service visit. The result: faster resolution, less lost production, and a customer who never experienced a problem they did not already know was being handled.
🔌 String Inverter Failure Scenario
Panel 7 of 20 fails silently. String output drops by ~5%. Daily weather variation masks the drop for 3 weeks. Customer notices higher electricity bill. Technician dispatched. 3-week diagnosis window: approximately 42 kWh lost on a 10 kW system.
⚡ Microinverter Failure Scenario
Panel 7 microinverter fails. Alert triggered within 8 minutes. Installer portal notifies service team. Remote diagnosis confirms microinverter failure. Part ordered same day, service scheduled. Diagnosis window: approximately 6 hours of lost production from that one panel only.
Identifying Soiling and Cleaning Schedules
A useful real-world data point for distributor training: a study published in Applied Energy found that in high-dust environments, unmonitored panels lost an average of 6.9% of annual production to soiling — losses that monitoring-triggered cleaning schedules reduced to under 2%. That difference, on a 10 kW system at $0.14/kWh, is approximately $69 per year in recovered electricity value — just from timely cleaning.
Panel-level monitoring identifies soiling through its characteristic performance signature: a group of adjacent panels showing gradual, correlated output decline over days — distinct from the sharp single-panel drops of equipment failure and the time-dependent patterns of shading. When this pattern emerges, the platform calculates the economic case for cleaning: “Soiling is currently reducing your output by 4.2%, costing approximately $12 per month. Cleaning your panels today would recover that within the first clear production day.”
Diagnosing Electrical Issues
Voltage fluctuations and current imbalances at the panel level are early indicators of wiring degradation, connector corrosion, or grounding issues — problems that in a string inverter system would only surface after they became significant enough to affect total array output. Panel-level voltage data showing one panel operating at consistently lower voltage than its neighbors, despite similar irradiance conditions, points to a connection issue that can be resolved in a single targeted service visit rather than a comprehensive system inspection.
🎬 Watch: Enphase Panel-Level Monitoring Explained
The following official tutorial from Enphase Energy walks through the Enphase App interface in detail — showing exactly what homeowners see when they open their monitoring dashboard. This is an excellent resource for distributor training and for sharing with customers during the sales process:
▶ “The Enphase App Tutorial” — official platform walkthrough. Share this with customers during the pre-sale and post-installation phases.
6. Comparative Analysis: Panel-Level vs. System-Level Monitoring
Why Granular Data Beats Aggregate Monitoring
The core argument is deceptively simple: string inverters show you that something is wrong. Microinverter monitoring shows you exactly what is wrong, where it is, when it started, and how much it is costing. For distributors, translating that distinction into commercial language is the difference between selling a monitoring feature and selling a value proposition.
| Monitoring Capability | String Inverter (System-Level) | Microinverter (Panel-Level) |
|---|---|---|
| Total system output | ✅ Yes | ✅ Yes |
| Individual panel output | ❌ No | ✅ Yes — per panel |
| Shading pattern identification | ❌ Not without technician visit | ✅ Automatic, real-time |
| Single panel failure alert | ❌ May take weeks to detect | ✅ Within 5–15 minutes |
| Soiling detection | ❌ Only visible in aggregate | ✅ Panel-specific pattern detection |
| Remote pre-diagnosis | ❌ Requires site visit | ✅ Fault type identifiable remotely |
| Customer engagement (app) | ⚠️ Basic — total production only | ✅ Rich — per-panel visual map |
| Predictive maintenance | ❌ Limited | ✅ AI-driven anomaly detection |
| Conformité à l'arrêt rapide | ⚠️ Requires additional hardware | ✅ Inherent in architecture |
Case Study: Real-World Performance Differences
A 2025 California commercial rooftop case (500 kW warehouse installation) illustrates the monitoring difference precisely. The system had partial shading from HVAC units on the roof that was not fully captured during the pre-installation assessment. Prior to MLPE adoption, string inverter monitoring showed the system producing at 88% of modeled expectations — a gap attributed to “weather variation” for the first three months.
When the facility switched to power optimizers with panel-level monitoring, the data immediately revealed that 23 specific panels were producing 40–60% below expected output due to HVAC unit shadows between 10 AM and 1 PM. Reconfiguring those panel strings — a change informed entirely by panel-level data — recovered 9% of annual system production, or approximately 45,000 kWh per year. At a commercial electricity rate of $0.11/kWh, that represents $4,950 in additional annual revenue from the same installation.
ROI Justification for Customers
The standard objection to microinverters is their cost premium — typically 15–30% more than an equivalent string inverter system. The monitoring advantage is a key component of the ROI argument that overcomes this objection. Here is the framework:
- Early fault detection: Catching a failed microinverter 6 weeks earlier than a string inverter system would = ~42 kWh recovered per panel at risk, worth approximately $5.90 at residential rates. Across a 25-year system life with 2–3 anticipated microinverter replacements, the detection speed advantage has measurable production value.
- Optimal cleaning schedules: Data-driven cleaning vs. arbitrary calendar cleaning saves 1–2 cleaning events per year while recovering the same or more production — a direct cost saving of $50–$150 annually depending on roof size and local service rates.
- Avoided technician visits: Remote diagnosis capability eliminates 1–2 diagnostic site visits per system over a 5-year period, saving $300–$600 in service costs.
7. Advanced Features: Going Beyond Basic Monitoring

Advanced monitoring platforms integrate solar production, battery storage, energy consumption, and grid interaction into a unified dashboard — transforming a solar system into an actively managed home energy asset.
Energy Consumption Integration
The most forward-thinking monitoring platforms now integrate solar production data with household energy consumption data — showing customers not just “how much are we generating?” but “how much of what we generate are we actually using?” This self-consumption rate is one of the most commercially powerful metrics for customer engagement.
When a homeowner can see that their system is producing 3.2 kW at 11 AM and their household is only consuming 1.4 kW, the monitoring platform’s recommendation is immediate: “Run your dishwasher now. Use your EV charger. Run the washing machine.” Shifting these loads to peak solar production hours can increase self-consumption rates from 30–40% to 60–70% — dramatically improving the economics of the system without adding any hardware.
For distributors, this feature justifies a higher-tier monitoring subscription and positions the company as a home energy management advisor rather than a hardware vendor. It is the kind of ongoing value that customers talk about. For reference, platforms from leading brands discussed in the Enphase App ecosystem already offer this integration natively.
Battery Storage Integration
For hybrid systems with battery backup — an increasingly common configuration as battery costs have dropped 93% since 2010, reaching approximately $192/kWh by 2024 — panel-level monitoring coordinates with battery management to optimize the entire energy flow: solar production → battery charging → household consumption → grid export/import.
Panel-level data feeds this optimization precisely. Rather than a single “solar is producing X watts” input to the battery management system, each panel’s individual output is factored into charging schedule decisions. On a morning with one panel still shaded by a neighboring building, the system knows the shaded panel will clear by 10 AM and plans battery charging accordingly — maximizing the capture of peak production hours.
Utility Grid Interaction Metrics
Advanced monitoring now tracks how the solar system interacts with the grid at a level of detail that most homeowners and many installers have never seen. Frequency response data, voltage regulation contributions, and export vs. import flow — all visible in real time — are becoming critical as utilities expand demand response and virtual power plant (VPP) programs.
For distributors serving markets where net metering rates are changing or time-of-use tariffs are in effect, the ability to show customers their grid interaction data is a powerful argument for system value. “Your system exported 4.8 kWh to the grid between 1 PM and 4 PM at the peak export rate, and imported 3.1 kWh after 7 PM at the standard rate” — that level of transparency makes the economics of solar concrete rather than abstract.
8. Data Security and Privacy: Building Customer Trust
How Monitoring Data Is Protected
Solar monitoring systems collect and transmit data continuously — production records, consumption patterns, device status, and in integrated systems, home occupancy patterns inferred from consumption data. This is personal data in the regulatory sense, and distributors must be prepared to discuss how it is protected.
Leading microinverter monitoring platforms implement multiple security layers: HTTPS/TLS encrypted data transmission between the local gateway and cloud servers, two-factor authentication for account access, role-based access controls that allow customers to grant limited installer access without sharing full account credentials, and regular third-party security audits aligned with frameworks like the NIST Cybersecurity Framework.
The U.S. Department of Energy has specifically identified cybersecurity for distributed energy resources (DERs) — including residential solar monitoring systems — as a national priority, funding initiatives to develop secure communication standards as DER capacity is expected to quadruple in the coming years.
Privacy Considerations for Homeowners
The data collected by monitoring platforms falls into distinct categories with different sensitivity levels. Production data — how much electricity your panels generated — is low sensitivity. Consumption pattern data — when electricity was used, correlated with household activity — is more sensitive because it can reveal occupancy patterns. Integration data from smart thermostats or EV chargers adds another layer.
Distributors should proactively address these distinctions. “The monitoring platform collects your panel production data and optionally your consumption data if you connect a smart meter. This data is stored encrypted on the manufacturer’s secure servers and is never sold to third parties. You control who has access — including whether your installer can view it for support purposes. You can review and export all your data at any time.” This level of transparency builds trust and addresses concerns before they become objections.
Compliance with Regulations
For distributors operating in California, CCPA (California Consumer Privacy Act) applies to the data collected by monitoring platforms used in their market. For distributors with European customers or European operations, GDPR (General Data Protection Regulation) governs data collection, storage, and the right to deletion. Verify that your chosen platform provider has documented compliance with the regulations relevant to your markets — and keep that documentation available for customers who ask.
9. Training and Support: Empowering Your Sales Team
Distributor-Level Platform Training
A distributor sales team that cannot fluently navigate the monitoring platform they are selling is at a significant credibility disadvantage — particularly when competing against installers who have been working with these platforms for years. Platform proficiency is not a nice-to-have; it is a qualification for premium market positioning.
Enphase, APsystems, SolarEdge, and Hoymiles all offer formal distributor training programs with demo account access. Prioritize training that covers: the installer portal (for managing multiple customer accounts), alert configuration and escalation procedures, performance data interpretation (distinguishing weather variation from genuine underperformance), and the customer onboarding workflow. A sales team member who can open a laptop during a customer meeting and walk through a live installation’s panel performance data in real time is demonstrating expertise that closes deals.
- Request demo accounts from each major platform provider your team sells. Use these for internal training before client-facing presentations.
- Train for the customer onboarding conversation — the first app walkthrough after installation is the moment that determines whether the customer becomes an engaged advocate or a passive user.
- Master alert interpretation — know the difference between a weather-related performance dip and an equipment fault flag. Your customers will call you with both.
- Practice the ROI conversation — be able to pull up historical production data and calculate how much the monitoring system helped recover in a specific scenario.
Creating Customer Education Materials
Post-sale documentation is one of the highest-leverage investments a distributor can make in customer satisfaction. Customers who receive a clear, visual one-page guide explaining their monitoring app are dramatically less likely to call with basic support questions — and dramatically more likely to refer their experience positively to neighbors.
Effective customer education materials include: a visual “first week” guide to their monitoring app, a reference card explaining what different alert types mean and what action to take, a seasonal production expectations chart (so they know their January output being lower than July is normal), and a one-page FAQ for the most common monitoring questions. Jia Mao BIPV supports distribution partners in developing customized versions of these materials for their specific product mix and markets.
Establishing Ongoing Support Protocols
Define clearly before the first installation: who is the first point of contact when a customer calls about a monitoring alert? What is the escalation path if the alert indicates a hardware fault? What is the target response time for different alert severity levels? Distributors who answer these questions in writing — and communicate the answers to customers at the time of installation — experience significantly fewer friction points in the post-sale relationship.
10. Future Trends and Emerging Technologies

Next-generation solar monitoring is converging with AI, smart home ecosystems, and distributed grid participation — creating an energy management landscape that is fundamentally more dynamic than today’s “generate and measure” model.
AI-Powered Performance Optimization
The monitoring platforms of 2025–2026 are beginning to cross a meaningful threshold: from systems that report what happened to systems that predict and recommend what will happen. This shift is driven by the accumulation of large-scale training data across millions of installed microinverter units.
AI algorithms trained on this data can now identify the early signatures of failing microinverters 30–90 days before failure with documented accuracy. They can predict soiling accumulation rates based on local weather patterns, satellite imagery, and local air quality data — generating automated cleaning recommendations before the soiling is even visible in performance data. And they can optimize battery charging and discharging schedules based on hyperlocal weather forecasts, real-time electricity tariff signals, and predicted household demand — maximizing the economic return from every kWh generated.
According to a 2024 analysis by the World Economic Forum, AI-driven operations and maintenance for solar systems can reduce unplanned downtime by 30–40% and increase annual energy production by 5–15% relative to non-AI-assisted systems. For a 10 kW residential system, that production improvement alone represents $98–$294 per year in additional electricity value.
Integration with Smart Home Ecosystems
The next major frontier for solar monitoring is deep integration with the broader smart home ecosystem. Voice assistant commands (“Hey Google, how much did my solar system produce today?”), automated load shifting triggered by monitoring data (the washing machine starts automatically when solar production exceeds household demand), and seamless EV charging coordination (the car begins charging when production peaks and pauses when a cloud passes) are all in active development or already available on cutting-edge platforms.
The Home Assistant open-source platform already supports solar monitoring integration for technically sophisticated homeowners. Commercial platforms from major manufacturers are moving toward similar native integrations. For distributors, the positioning opportunity is significant: solar is no longer a separate system bolted onto the house — it is the energy intelligence layer that makes the smart home work.
Blockchain and Distributed Energy Resources
Looking further ahead, blockchain technology is being explored as a mechanism for transparent, tamper-proof recording of renewable energy generation — creating verifiable renewable energy credits (RECs) that individual homeowners could trade directly on energy markets. The distributed, panel-level data that microinverter monitoring already collects is precisely the input that these systems would need to function: granular, timestamped, hardware-verified production records for every kilowatt-hour generated.
Virtual Power Plants (VPPs) — utility programs that aggregate thousands of residential solar and battery systems into a coordinated grid resource — are expanding rapidly in California, Texas, and Australia. Microinverter monitoring’s real-time communication architecture is better positioned for VPP participation than centralized string inverter architectures, giving microinverter system owners a potential future revenue stream that string inverter owners may not be able to access. For distributors advising forward-thinking customers, this is a compelling long-term value argument.
Conclusion: Positioning Panel-Level Monitoring as a Competitive Advantage
Panel-level monitoring transforms solar systems from passive infrastructure into actively managed energy assets. The data it generates is not just technically interesting — it is commercially decisive. It catches problems earlier, drives better maintenance decisions, engages customers more deeply, and provides the diagnostic foundation for a service model that generates recurring revenue long after the installation check clears.
For solar distributors and agents, the competitive advantage from mastering this technology is compounding. The first sale is closed with better data and more confident presentations. The post-sale relationship is stronger because customers feel informed and supported. The referral comes because the customer had an experience worth sharing — not just a product worth having.
The solar monitoring market’s projected growth from $1.26 billion to $3.26 billion by 2034 reflects a fundamental market shift: customers are increasingly choosing systems based on what they can see and control, not just on what they generate. Distributors who build platform expertise, develop customer education materials, and train their teams to use monitoring data in sales conversations are positioning themselves on the right side of that shift.
At Jia Mao BIPV, we work with distribution partners to develop the product knowledge, sales tools, and technical training that make this positioning real. Panel-level monitoring is not a feature your team sells — it is a capability your team demonstrates. The difference between those two things is the difference between a transaction and a relationship.
🚀 Ready to Educate Your Customers and Close More Deals?
Equip your sales team with the tools to turn monitoring data into compelling customer conversations:
📋 Schedule a platform demo with leading microinverter manufacturers | 📦 Download our distributor toolkit with customer-ready infographics | 🎓 Register for our webinar series on advanced monitoring configuration | 🛠️ Connect with our technical team to develop customized training materials
📖 Glossary of Key Terms
| Term | Definition |
|---|---|
| Panel-Level Monitoring | Real-time performance tracking of each individual solar panel, enabled by microinverters or power optimizers at the module level. |
| Microinverter | A compact inverter installed at each solar panel that converts DC to AC power at the module level and transmits individual panel performance data. |
| MLPE | Module-Level Power Electronics — umbrella term covering microinverters and power optimizers that operate at the individual panel level. |
| Performance Ratio (PR) | The ratio of actual system electricity output to theoretical maximum output for the same sunlight conditions. Expressed as a percentage; healthy residential systems typically achieve 75–85%. |
| Temperature Coefficient | The rate at which a solar panel’s output decreases per degree Celsius above 25°C. Typically -0.3% to -0.5%/°C for crystalline silicon panels. |
| Soiling | The accumulation of dust, pollen, bird droppings, or pollution particulates on panel surfaces that reduces light transmission and output. |
| Self-Consumption Rate | The percentage of solar energy generated that is used directly by the household, rather than exported to the grid. Higher self-consumption improves system economics. |
| VPP (Virtual Power Plant) | A utility-managed program that aggregates multiple distributed residential solar and battery assets into a coordinated grid resource for demand response. |
| Arrêt rapide | NEC 2020 Section 690.12 requirement to de-energize roof conductors to ≤30V within 30 seconds of activation, for firefighter safety. |
| DER | Distributed Energy Resource — small-scale power generation or storage units located at or near the consumer, including residential solar systems. |
| CCPA | California Consumer Privacy Act — state privacy law governing collection, use, and disclosure of personal data for California residents. |
| GDPR | General Data Protection Regulation — EU regulation governing personal data collection, processing, storage, and the rights of data subjects. |
❓ Frequently Asked Questions
Article produced by the technical content team at Jia Mao BIPV — Solar Inverter & BIPV Technology Solutions for Distributors and Project Partners Worldwide.
Sources: The Insight Partners PV Monitoring Market Report 2025; IEA PVPS Task 13 Soiling Report; World Economic Forum AI in Solar Analysis 2024; Sunpal/NREL Panel-Level vs. String Monitoring Field Study 2025; Enphase, APsystems, SolarEdge platform documentation.