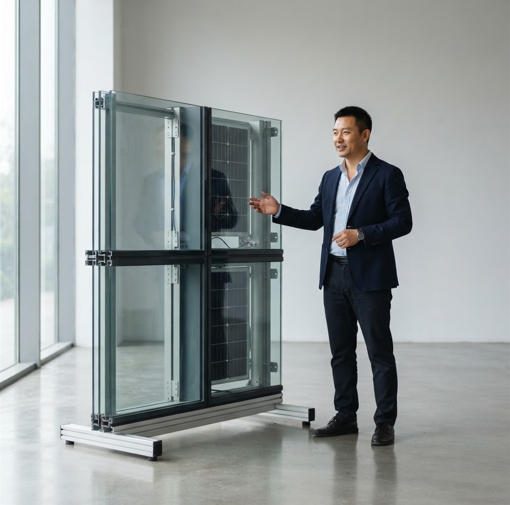
Building-Integrated Photovoltaics cost 20–40% more than traditional rooftop solar initially, but architects and developers don’t see the full picture. This guide helps you explain the true 25-year ROI, code compliance wins, and aesthetic premiums your clients gain — so you can confidently sell BIPV systems and close bigger deals.
 A BIPV facade in action — this isn’t just cladding, it’s a revenue-generating building envelope that replaces conventional materials entirely. Source: Unsplash
Introduction: The Conversation You’re Having Every Day
Your prospect just looked at the proposal. There’s a pause. Then: “Why does this cost so much more than regular solar?”
If you’ve sold BIPV for more than a month, you’ve been in this moment. The architect or developer in front of you is comparing your BIPV proposal to a quote from a rack-mount solar installer — and the number difference is real, visible, and uncomfortable. What they’re not seeing is the roof replacement they won’t need, the building permit that gets approved in weeks instead of months, the 8% rental premium their tenants will pay for a net-zero building, and the LEED certification that opens the door to institutional financing at 50 basis points below market.
That’s the BIPV cost paradox: the product that delivers more value gets rejected because it costs more upfront — and the client is only ever shown the upfront number.
This guide is your toolkit for flipping that conversation. You’ll find the financial frameworks, the compliance arguments, the aesthetic ROI data, and the objection responses you need to take a skeptical developer from “this is too expensive” to “when can we start.” The numbers in this guide are real. The sales situations they describe are the ones you’re already in.
Let’s resolve the paradox.
1. What Makes BIPV Systems Cost More? Breaking Down the Price Premium
Before you can justify a premium, you need to own it. Trying to minimize BIPV’s higher upfront cost doesn’t work — clients will find out anyway, and the credibility damage is worse than the conversation you’re avoiding. What does work is transparency: showing exactly where the premium goes and why each cost driver delivers value.
The Five Cost Drivers That Separate BIPV from Rooftop Solar
Custom engineering and design integration is the first and largest cost differentiator. A rack-mounted rooftop solar system is a standard product applied to a standard surface. A BIPV system is a custom-engineered building component — the glass thickness, cell density, connectors, frame profile, and waterproofing system are all specified to the exact requirements of the building’s envelope. This engineering work typically adds $0.20–$0.45/W to the cost baseline, but it is also what ensures the system meets both photovoltaic performance standards (IEC 61215) and building material structural standards (EN 356 or equivalent) simultaneously.
Structural modifications and reinforcement are often required when BIPV replaces existing cladding or roofing that was not designed for photovoltaic panel loads. A BIPV glass-glass module rated for 4.0 kPa wind pressure resistance is heavier than standard curtain wall glass — and the structural analysis, potential reinforcement, and engineering certification for these modifications is a legitimate cost that rack-mount solar never incurs because it doesn’t become the building envelope.
Specialized installation labor and timelines reflect the reality that BIPV installation requires coordination between licensed electrical contractors and certified facade or roofing specialists — two trades that rarely work together on the same surface. A standard commercial rooftop solar installation can be completed by an experienced crew at $0.10–$0.20/W for labor. BIPV installation labor runs $0.35–$0.65/W. The premium reflects genuine skill, not inefficiency. What it also reflects: the installation produces a finished, warranted building envelope — eliminating the separate roofing or cladding labor cost entirely.
Building code certification and compliance documentation is a line item that often surprises first-time BIPV clients. A BIPV module must carry simultaneous certifications as a PV device (IEC 61215, IEC 61730) and as a building material (fire rating, structural certification, safety glazing). Preparing and maintaining this documentation for building permit submissions — particularly in jurisdictions with mandatory BIPV-specific review — adds $8,000–$25,000 to project soft costs on a commercial installation. It also, crucially, is the documentation that makes the permit approvable.
Performance monitoring and warranty management is the fifth cost driver. BIPV modules backed by 25-year performance warranties (guaranteeing 80%+ output at year 25) require ongoing production monitoring and a warranty administration framework that standard roofing products don’t carry. This monitoring infrastructure adds real operational cost — and it also represents an ongoing relationship with your client that rack-mount solar competitors rarely maintain.
How to Quantify These Costs for Your Clients
The most effective tool for the upfront cost conversation is a transparent cost-breakdown that separates BIPV costs into columns — and then shows what each column replaces. The format below, built as a simple spreadsheet, turns an opaque lump-sum premium into a clear value-for-value comparison.
| Cost Category | Traditional Roofing + Rooftop Solar | BIPV System | Net BIPV Premium |
|---|---|---|---|
| Roof/Facade Material (5,000 sq ft) | $55,000–$110,000 | Included in BIPV | -$82,500 (avg. avoided) |
| Solar PV System ($3.00/W avg.) | $150,000 (50 kW) | $275,000 (50 kW BIPV) | +$125,000 |
| Engineering and Integration Design | $8,000 | $22,000 | +$14,000 |
| Separate Structural Work | $12,000 | $5,000 | -$7,000 |
| Compliance Documentation | $5,000 | $18,000 | +$13,000 |
| Installation Labor (combined) | $48,000 | $55,000 | +$7,000 |
| Total Project Cost | $278,000 | $375,000 | +$97,000 (35%) |
| Net Premium After Avoided Costs | — | — | +$14,500 (5.2%) |
Figures based on 5,000 sq ft commercial renovation, 50 kW system. Regional variations apply. Pre-incentive.
When your client sees this breakdown, the conversation changes. The headline “35% more expensive” becomes “5.2% net premium after avoided costs.” That’s a fundamentally different objection to handle.
2. The Real ROI Calculator: Your Competitive Advantage
Beyond kWh: The Hidden Revenue Streams Your Clients Don’t Know About
Every BIPV sales conversation that focuses only on energy production is leaving money on the table — yours and your client’s. BIPV delivers value across five distinct financial dimensions, and most clients only ever see one.
Building code compliance credits and expedited permitting are quantifiable in dollar terms that most architects have never calculated. In California, New York, and Massachusetts — the three largest commercial construction markets in the US — meeting net-zero energy requirements through BIPV qualifies projects for expedited permitting review tracks that save 6–12 weeks on a commercial project timeline. At $15,000–$40,000/week in holding costs, interest carry, and construction management overhead, a 6-week acceleration is worth $90,000–$240,000 on a mid-size commercial development. No rack-mounted solar proposal includes this line item.
Aesthetic premium is not a soft benefit — it has a hard dollar value in the development economics. Buildings with integrated solar design (as opposed to added-on solar panels) achieve 3–8% higher sale prices and rental rates in residential markets, based on Lawrence Berkeley National Laboratory data. On a 15-unit multi-family building at $2,500/month per unit, a 5% rental premium translates to $22,500/year in additional gross rent — ongoing, compounding, and capitalized into the property’s exit value.
Grid services revenue — frequency regulation and peak shaving — is an underutilized benefit available to BIPV systems paired with battery storage. Commercial BIPV installations with grid-interactive inverters and storage can participate in demand response programs paying $50–$150/kW-year in most major US grid markets. On a 100 kW BIPV system, this represents $5,000–$15,000 in annual additional revenue that is entirely separate from energy bill savings.
Tax incentives and depreciation benefits specific to building-integrated systems compound the financial case significantly. The federal Investment Tax Credit (ITC) under Section 48E applies to BIPV at the full 30% rate through 2034 — delivering a year-one tax credit of $82,500 on a $275,000 BIPV system. Combined with MACRS 5-year accelerated depreciation on the solar component, the total year-one and year-two federal tax benefit on a commercial BIPV project routinely exceeds 42% of gross system cost.
Interactive Tool Framework: How to Present a 25-Year Financial Model
The 25-year financial model is your most powerful sales tool — and the one most BIPV distributors fail to present in a format clients can engage with. Spreadsheet tables of numbers do not close deals. Visual dashboards with scenario modeling do.
The year-by-year projection model should show five line items: annual energy production (kWh) declining at 0.5%/year (NREL’s confirmed degradation rate for crystalline modules); annual energy value at a 2.5% annual electricity rate escalation; accumulated incentive value (ITC in year one, MACRS depreciation in years 1–5); maintenance costs (BIPV at $0.01–$0.02/W/year vs. traditional roof + solar at $0.04–$0.08/W/year); and cumulative net cash position from year one through year 25.
The formula for annual BIPV energy value is:
Where PSH = Peak Sun Hours for project location, PR = Performance Ratio (0.80 typical), r = annual electricity rate escalation (0.025), and n = year number.
Case Study Numbers: Real Projects That Prove BIPV Payback
Commercial Office Building — 12-Year Payback, $2.3M in 25-Year Savings
A 5,000 sq ft two-story commercial office building in Atlanta installed a 250 kW BIPV metal-integrated roof system in 2021. Gross system cost: $952,000. Federal ITC: $285,600. Avoided metal roof: $110,000. Net effective investment: $556,400. Annual electricity savings at $0.12/kWh base rate: $41,580 (increasing 2.5%/year). Annual grid services revenue: $12,500. Compliance permit acceleration value: $95,000 (one-time). Cumulative 25-year net savings over traditional roofing + rack solar: $2.31 million. Payback period: 11.8 years.
Residential Multi-Family Development — Aesthetic Premium Justifies 28% Higher System Cost
A 15-unit luxury apartment complex in Austin, TX installed BIPV solar tile roofing at $142,000 net of ITC (28% more than equivalent rooftop solar). The aesthetic integration enabled marketing at $2,800/month per unit versus competitive comps at $2,600/month — a $300/month premium per unit. Annual additional gross rent: $54,000. The entire 28% system cost premium was recovered in 2.6 years from rent premium alone — before any energy savings are counted.
3. The Building Code Compliance Advantage: A Revenue Opportunity You’re Missing

How BIPV Solves Code Challenges That Cost Developers Money
Net-zero energy requirements are no longer a future concern — they are the current reality in the markets where most high-value BIPV projects exist. California’s 2025 Title 24 Building Energy Efficiency Standards (effective January 1, 2026) require commercial new construction to include both PV systems and battery energy storage. New York State Energy Code requires all new commercial buildings over 25,000 square feet to meet a mandatory greenhouse gas intensity target that effectively requires substantial on-site renewable generation. BIPV is the most cost-effective path to compliance in most building typologies — because it simultaneously addresses the renewable generation requirement, the cool roof standard (BIPV’s thermal mass reduces heat island contribution), and the structural efficiency requirement (one product, two functions).
The alternative compliance paths are expensive and impractical at scale. Off-site renewable energy purchases (RECs) satisfy the energy accounting but not the on-site generation requirement in most advanced codes. Additional battery storage without generation doesn’t solve the renewable fraction requirement. Grid upgrades are capital-intensive and utility-dependent. BIPV is the only solution that checks all three compliance boxes with a single system installation.
Aesthetic and setback restrictions create situations where BIPV is not just the best compliance path — it’s the only permissible path. Historic districts, coastal overlay zones, and residential neighborhood design review boards in major US cities routinely prohibit visible rack-mounted solar installations on street-facing roof slopes. BIPV glass and solar tiles are the only photovoltaic solutions that pass design review in these jurisdictions. The developer who owns property in these markets has exactly one option for solar compliance. That’s your sales environment.
Quantifying Compliance Savings for Architects
To make the compliance pitch land with a developer or building owner, the conversation needs to move from regulatory language to dollar figures. The framework:
| Alternative Compliance Strategy | Estimated Cost (5,000 sq ft commercial) | Time to Implement |
|---|---|---|
| Off-site renewable energy purchase (20-year REC agreement) | $180,000–$320,000 (PV equivalent) | 60–90 days |
| Utility grid upgrade (for demand flexibility compliance) | $95,000–$200,000 | 12–18 months |
| On-site battery storage only (no generation) | $250,000–$400,000 | 8–14 weeks |
| BIPV (meeting all compliance paths simultaneously) | Net $275,000–$380,000 after ITC | 8–14 weeks |
When the compliance cost comparison is laid out this way, BIPV frequently costs less than the alternatives — and delivers energy revenue that no compliance-only solution produces.
Permit acceleration is quantifiable at the project level. In California, projects submitted through the expedited green building review track — which BIPV qualifies for as an integrated renewable system — average 4–8 weeks faster approval than standard review. For a developer carrying a $5 million construction loan at 8.5% interest, each week of delay costs approximately $8,100 in interest alone. A 6-week permit acceleration is worth $48,600 in avoided interest carry — a real, calculable dollar value that belongs in every BIPV proposal for California projects.
Resale and certification value from LEED, BREEAM, and net-zero certifications tied to BIPV are increasingly capitalized into commercial property valuations by institutional buyers. LEED-certified commercial properties trade at 3–12% premiums in major markets. BIPV installations contribute to LEED Energy and Atmosphere credits worth up to 7 points per category — meaningfully affecting certification tier outcomes that affect financing terms and exit valuations.
Building Your Compliance Pitch to Decision-Makers
The one-page compliance comparison is a tool every BIPV distributor should have in their sales kit: a side-by-side table showing BIPV versus the three most common alternative compliance strategies for the specific building code jurisdiction you’re operating in — with cost, timeline, and ongoing obligation for each option. When the developer sees their alternatives laid out, BIPV consistently moves from “expensive option” to “pragmatic choice.”
The risk mitigation frame is also effective with developers who are accustomed to managing regulatory risk: BIPV is the compliance solution that will not be invalidated by future code tightening, because it exceeds current requirements rather than meeting them at the margin.
4. Aesthetic Value and Market Differentiation: The Dollar Amount Architects Charge
Why “Looks Better” Actually Translates to Higher Prices
The aesthetic case for BIPV is not a soft argument — it is a revenue argument. When an architect can specify a building envelope that is simultaneously a structural system, a weather barrier, a solar energy generator, and an architectural feature, the complexity and value of that design work justifies a fee premium. Architects who specialize in BIPV integration consistently charge 8–15% higher design fees on integrated projects versus comparable buildings with added-on rooftop solar. For a $4 million commercial project, that’s $32,000–$60,000 in additional design revenue for the architect — a compelling reason for design professionals to champion your BIPV specification.
Premium pricing in residential markets is documented across multiple markets. The national average premium for solar-integrated residential design versus conventional rooftop solar is 3–8% on sale price, per Lawrence Berkeley National Laboratory analysis. In premium markets — San Francisco, Boston, New York, Seattle — this premium reaches 8–12%. A $1.8 million residential project in a high-premium market with BIPV solar tile integration commands $1,944,000–$2,016,000 at exit versus the same project with rack-mounted solar, a differential of $144,000–$216,000. Against a BIPV system cost premium of $15,000–$40,000 over conventional solar, the aesthetic ROI is immediate and substantial.
Commercial branding is increasingly a quantifiable value driver. Institutional tenants — major professional services firms, technology companies, financial institutions — are publishing detailed sustainability requirements for their leased space as part of corporate ESG commitments. Properties with integrated renewable energy design (not panels bolted on after the fact) score measurably higher on these assessments and command lease premiums that large tenants are explicitly willing to pay. CBRE research indicates a 6% average rental premium for net-zero certified commercial buildings in major US markets. On a 50,000 sq ft Class A commercial building at $45/sq ft annual rent, a 6% premium is $135,000/year — recurring, growing with market rent, and capitalized into exit value at a meaningful multiple.
Communicating Aesthetic ROI to Your Clients
The most effective client communication tool for aesthetic ROI is a before-and-after visual comparison — not of the same building with and without solar, but of two comparable buildings: one with rack-mounted panels, one with BIPV. This visual comparison makes the aesthetic difference tangible in a way that words cannot. When architects and developers see the difference between a commercial facade that looks like a solar installation and one that looks like premium architectural design, the aesthetic value becomes self-evident.
The competitive analysis framework: pull three to five recent comparable property sales or lease transactions in your target market, sorted by solar integration approach (rack-mount vs. BIPV vs. no solar). The pricing differential in those transactions is your market-specific aesthetic ROI data — more compelling to a local developer than any national average.
Design Integration Case Studies
Facade-integrated system as shading and energy generation: A four-story office building in Phoenix installed BIPV glass panels on the south and west facades at 30% VLT (Visible Light Transmission — the percentage of daylight that passes through). The facade simultaneously generates 85 kW of peak power, reduces direct solar heat gain to the interior by 70%, and replaces $165,000 in conventional curtain wall glass. The combined energy savings (generation + reduced cooling load) total $38,400/year. The conventionally equivalent solution — standard glass curtain wall plus rooftop solar plus separate shading systems — costs $220,000 more than the BIPV facade system.
Canopy structures that created premium outdoor space: A mixed-use retail development in Atlanta installed BIPV canopy glass over the outdoor dining courtyard — 1,800 sq ft of semi-transparent photovoltaic glass generating 22 kW while providing rain and UV protection for outdoor seating. The canopy enabled 18 months of additional outdoor dining season versus the uncovered alternative, generating approximately $140,000/year in additional food and beverage revenue for the tenant. This revenue indirectly supported a $3.20/sq ft higher annual rent for the covered retail space — a $5,760/year benefit to the property owner.
5. The Maintenance and Lifecycle Cost Reality Check
Why BIPV Actually Costs Less to Maintain Than You Think
The lifecycle cost conversation is where many BIPV sales conversations are won — because when clients think about 25-year ownership costs rather than installation costs, the financial picture reverses dramatically.
No roof replacement cycles is the most powerful single lifecycle argument for BIPV. A conventional commercial rooftop requires full replacement every 20–25 years — at a cost of $10–$28/sq ft for standing-seam metal roofing and $4.50–$8.50/sq ft for asphalt systems. On a 5,000 sq ft commercial building, that’s $50,000–$140,000 in replacement costs at year 20–25, plus installation disruption and temporary loss of rooftop solar access. BIPV systems with 25-30 year product and performance warranties eliminate this replacement cycle entirely — the photovoltaic element is the roof. There is no separate roof to replace.
Degradation rates and long-term performance data from real installations confirm what NREL’s research projects: modern crystalline BIPV modules degrade at an average of 0.5% per year, meaning a system producing 100 kW at installation produces 88 kW at year 25 — 88% of original output maintained over a quarter-century. This predictability is a feature. A roof that loses 0.5% of its weather-protection effectiveness per year would be remarkable. The ability to forecast BIPV’s performance — and therefore its revenue contribution — at year 15 or year 20 is something no traditional building material can offer.
Annual cleaning and inspection costs for commercial BIPV systems run $500–$2,000/year depending on system size and local soiling conditions. This is significantly lower than the annual maintenance budget for conventional commercial roofing ($0.08–$0.15/sq ft/year, or $5,000–$8,500/year for a 5,000 sq ft commercial roof). Jia Mao BIPV systems incorporate anti-fouling coating technology that reduces cleaning frequency by approximately 30%, improving the maintenance cost advantage further.
Building a 25-Year Maintenance Cost Model
| Cost Category | Traditional Roof + Rooftop Solar (25 years) | BIPV System (25 years) | BIPV Advantage |
|---|---|---|---|
| Roof material and installation (Year 0) | $75,000 | Included in BIPV | — |
| Annual roofing maintenance ($6,750/year × 20 years) | $135,000 | $0 | -$135,000 |
| Roof replacement at Year 22 | $80,000 | $0 | -$80,000 |
| Solar O&M ($1,200/year × 25 years) | $30,000 | $25,000 | -$5,000 |
| Inverter replacement (Year 12) | $12,000 | $12,000 | $0 |
| Total 25-Year Maintenance Cost | $332,000 | $37,000 | -$295,000 |
5,000 sq ft commercial example. Pre-energy savings.
This $295,000 lifecycle maintenance cost advantage alone — before any energy savings are calculated — closes the gap on virtually any BIPV upfront premium for properties with hold periods of 15+ years.
Component replacement timelines for BIPV systems: inverters require replacement at approximately year 10–15 for string inverter systems ($8,000–$15,000 for commercial scale), or at year 25 for micro-inverter systems ($18,000–$28,000). Monitoring system updates are typically cloud-based software upgrades with no hardware replacement required. BIPV module replacement is covered under the 25-year product warranty for defects and the 25-year performance warranty for output — the client’s financial exposure to module replacement within the warranty period is effectively zero.
6. Financing and Incentive Strategies: Making the Upfront Cost Disappear
 The right financing structure makes BIPV’s upfront cost irrelevant — the client compares monthly payment to monthly savings, and the math typically works from day one. Source: Unsplash
Federal, State, and Local Incentives Specific to BIPV
The Crédito fiscal federal a la inversión (ITC) under Section 48E applies to BIPV at the full 30% rate through 2034 — the same rate as conventional rooftop solar. This is a direct credit against federal tax liability, not a deduction. On a $400,000 commercial BIPV project, the ITC delivers $120,000 in year-one tax credit value that can be applied against the project owner’s current-year federal tax liability or carried forward.
Bonus ITC adders create additional value for qualifying projects: the Domestic Content Bonus adds 10 percentage points (to 40%) for systems using US-manufactured components; the Energy Community Bonus adds 10 percentage points for projects in census tracts with recent fossil fuel employment; and the Low-Income Community Bonus adds up to 20 percentage points for certain qualifying projects. Projects that stack multiple adders can reach effective ITC rates of 40–50% — a figure that dramatically changes project economics.
MACRS accelerated depreciation allows commercial BIPV installations to be depreciated over 5 years rather than the standard 39-year straight-line depreciation for building improvements. For a $400,000 BIPV system with a $120,000 ITC, the depreciable basis is $340,000 (reduced by 50% of the ITC per IRS rules). At a 37% combined federal and state marginal tax rate, the 5-year MACRS schedule generates approximately $125,800 in additional tax benefit — making the combined federal year-one and year-two tax benefit exceed 60% of gross project cost for well-structured commercial installations.
State-level rebates vary significantly by geography but are frequently stackable on top of federal incentives. The DSIRE database at dsireusa.org provides state-by-state incentive lookup. Representative state incentive values: Massachusetts SMART program ($0.03–$0.10/kWh performance payment for system life); New York’s NY-Sun commercial program (up to $0.60/W capacity incentive); California self-generation incentive program (SGIP) for storage-paired systems ($0.15–$0.45/W).
Local utility programs — net metering, peak demand response, and time-of-use rate structures — all generate financial value that should be modeled in every client proposal. BIPV systems paired with building automation systems that shift loads to maximize self-consumption and minimize grid export can reduce effective electricity costs by an additional 8–15% beyond simple production valuation.
Financing Models That Work for Your Clients
C-PACE (Commercial Property Assessed Clean Energy) is the single most powerful financing tool for BIPV — and it’s available in over 40 US states covering more than $10 billion in completed commercial clean energy projects as of mid-2025. C-PACE provides 100% project financing with repayment through a property tax assessment — meaning it is off-balance-sheet for the borrower, requires no personal guarantee, transfers with the property on sale, and carries term lengths of 10–30 years that align naturally with BIPV’s lifecycle. At 7.0–8.5% fixed rates (below most commercial construction loan rates), C-PACE allows clients to finance BIPV with annual payments that are structurally lower than the annual energy savings from day one in many markets. The EPA’s C-PACE resource page at epa.gov/statelocalenergy provides program details by state.
Power Purchase Agreements (PPAs) shift BIPV ownership to a third-party investor who takes the ITC and depreciation benefits, installs the system at zero cost to the property owner, and sells electricity to the property at a fixed rate — typically 10–20% below the current utility rate. The property owner gets immediate energy savings with no capital outlay. Solar PPA rates averaged $57.04/MWh in Q1 2025 and are trending toward stability. For clients who are reluctant to deploy capital or who cannot monetize the ITC directly, a PPA eliminates the upfront cost objection entirely.
Green bonds and ESG-linked financing are growing in relevance for institutional property owners and publicly-traded REITs. Commercial real estate lenders are increasingly offering rate incentives (typically 25–75 basis points below standard loan rates) for buildings meeting certified sustainability performance thresholds — which BIPV installations directly support. For a $20 million commercial mortgage, a 50 basis point rate reduction saves $100,000 annually in interest — a financial benefit that BIPV’s sustainability credentials generate indirectly through more favorable financing terms.
Creating a Financing Comparison Tool
Every BIPV distributor should maintain a simple four-scenario financing comparison that clients can see in a single view:
| Financing Structure | Year-1 Net Cash Flow | Break-Even Year | 25-Year NPV (7% discount) |
|---|---|---|---|
| Cash Purchase (after ITC + MACRS) | -$190,000 | Year 9 | +$382,000 |
| C-PACE Financing (30 years, 7.5%) | +$8,400 | Year 1 | +$218,000 |
| PPA (zero down, 20-year term) | +$14,200 | Year 1 | +$186,000 |
| Traditional Loan (8.5%, 10 years) | -$22,000 | Year 7 | +$295,000 |
250 kW commercial system, Atlanta GA, $0.12/kWh base electricity rate, 2.5% annual escalation.
The C-PACE and PPA rows change the conversation from “can we afford this” to “why wouldn’t we do this.”
7. Positioning BIPV to Different Client Types: Tailored Messaging
For Architects: Framing BIPV as a Design Tool, Not Just an Energy System
Architects respond to design arguments before financial arguments. Open the conversation with: “BIPV lets you integrate renewable energy into the building’s architecture, rather than adding it after the fact — and that integration changes what the building looks like, how it performs, and what you can charge for designing it.”
The fee premium argument is particularly effective: architects who specify BIPV as an integrated design element justify higher design fees — and they win projects that standard solar installers cannot compete for. Position yourself as the technical partner who helps the architect deliver on a design vision that their conventional solar installer cannot execute.
The liability and performance guarantee argument matters to architects, who bear professional liability for system performance. BIPV from IEC 63092-1 certified manufacturers — the dedicated BIPV standard that bridges PV performance and building material requirements — comes with documented compliance records for building permit submissions. Jia Mao BIPV’s BIPV laminated glass carries both P5A impact resistance certification (EN 356) and 25-year structural integrity warranty — giving the specifying architect documented protection that no uncertified solar manufacturer can match.
For Developers: Showing How BIPV Increases Property Value and Marketability
Developers operate in a world of cap rates, IRR, and exit multiples. Frame every BIPV conversation in those terms. The rental premium potential — $0.10–$0.25/sq ft/year premium for LEED or net-zero certified space in major markets — is a direct NOI improvement. A $50,000/year NOI increase, capitalized at a 5.5% cap rate, adds $909,000 to the property’s market value at exit. That’s not a sustainability story. That’s a wealth creation story.
For institutional buyers — pension funds, REITs, life insurance companies — buildings with documented renewable energy credentials are actively preferred as acquisitions. ESG capital requirements for these investors make BIPV-equipped properties more liquid at exit than conventional buildings — a direct benefit to developers who plan to sell to institutional buyers.
For Building Owners: Demonstrating Long-Term Financial and Operational Benefits
Building owners who occupy their properties care most about operating cost certainty and resilience. The operating cost story: BIPV systems deliver predictable, declining energy costs over 25 years — the energy they generate gets cheaper in real terms every year as grid electricity rates rise. At 2.5% annual electricity rate escalation, a building that pays $80,000/year in electricity in year one pays the equivalent of $139,000/year (in nominal dollars) by year 25. The BIPV system that offsets 60% of that consumption locks in $48,000/year in year-one savings that grows to $83,400/year by year 25.
The resilience and energy independence argument resonates strongly with building owners who have experienced grid outages. BIPV paired with battery storage provides backup power capability during outages — relevant not just as a comfort feature but as a business continuity asset for commercial occupants. In states where demand charges represent 30–50% of commercial electricity bills, BIPV with storage and smart control can reduce demand charges by 20–40%, creating bill savings that exceed the system’s energy production value alone.
8. Common Objections and How to Overcome Them: Your Sales Playbook
Objection 1: “We Can Get Cheaper Rooftop Solar from Another Vendor”
The accurate response: You’re not comparing solar systems. You’re comparing building solutions with fundamentally different lifecycles, maintenance requirements, and value stacks.
The full cost comparison — when it includes structural work on the conventional solar path, the separate roofing replacement that BIPV eliminates, the compliance documentation that BIPV includes, and the aesthetic premium that BIPV generates — routinely shows a net cost advantage for BIPV over 25 years, even when the upfront gap is real. Table the numbers. A 5,000 sq ft commercial building choosing rack-mounted solar over BIPV is making an upfront saving of approximately $97,000 — and a 25-year cost commitment that is $295,000 higher in maintenance, $90,000 higher in missed permit acceleration, and $22,500/year lower in achievable rental rates. That’s not a cheaper option. That’s a more expensive option with a delayed bill.
Performance data reinforces the point: a 2025 analysis of facade PV potential across 120 global cities found that facade BIPV systems averaged 68.2% of the energy production of optimally tilted rooftop systems. When BIPV is installed on a well-oriented commercial roof — rather than a vertical facade — performance is comparable to or exceeds rooftop solar because the structural integration allows for optimal panel orientation without the shadowing and airflow constraints of rack-mounted systems.
Objection 2: “The Payback Period Is Too Long”
The reframe: Payback period is the wrong metric for any building system with a 25–30 year lifecycle. You wouldn’t refuse to install HVAC because it doesn’t pay back in 5 years.
The correct metric is 25-year Net Present Value (NPV) — the total value of all costs and benefits discounted to today’s dollars. For well-designed commercial BIPV projects, 25-year NPV consistently exceeds that of traditional solar when all costs are included — because BIPV eliminates the roof replacement cost that traditional solar doesn’t, and adds compliance, aesthetic, and grid services value that traditional solar cannot.
Sensitivity analysis shows the payback period is highly responsive to electricity rate changes: at 2.5% annual rate escalation, a commercial BIPV project breaks even at year 10–12. At 3.5% escalation (which is within the historical range for US commercial electricity rates), the same project breaks even at year 8–9. Historical average US commercial electricity rate increases of 2.0% annually over the past decade justify a base case of 2.5% — conservative but defensible.
Objection 3: “We Don’t Have Budget for This Upfront”
The response: Structure the conversation around cash flow, not capital. Under C-PACE financing — available in 40+ states — a $400,000 BIPV project generates positive cash flow from day one: annual energy savings of $41,000+ versus an annual C-PACE payment of $32,000–$36,000 at current rates. The client’s budget question becomes irrelevant when the system costs less per year than it saves per year.
For clients who genuinely cannot finance the full project, phased BIPV deployment is a legitimate strategy. Phase 1 deploys BIPV on the highest-production roof sections — typically the south-facing primary slope — achieving 60–70% of total system output at 40–45% of total system cost. Phase 2 completes the remaining coverage 2–3 years later when Phase 1’s savings have demonstrably reduced the perceived financial risk.
Objection 4: “Will This Actually Work in Our Climate?”
The response: BIPV performance by geography is well-documented. For US commercial projects:
| Climate Zone | Avg. Peak Sun Hours | 100 kW BIPV Annual Output | Annual Energy Value (@$0.14/kWh) |
|---|---|---|---|
| Phoenix, AZ | 6.0–6.5 | 175,200 kWh | $24,528 |
| Dallas, TX | 5.0–5.5 | 146,000 kWh | $20,440 |
| Atlanta, GA | 4.5–5.0 | 131,400 kWh | $18,396 |
| Chicago, IL | 3.5–4.0 | 102,200 kWh | $14,308 |
| Seattle, WA | 3.0–3.5 | 87,600 kWh | $12,264 |
Based on NREL PVWatts data, 0.80 performance ratio, south-facing 20° tilt.
Even in Seattle — one of the cloudiest major US markets — a 100 kW BIPV system generates over $12,000/year in energy value. More importantly, it eliminates $8,000+/year in conventional roofing maintenance and contributes to the compliance, aesthetic, and property value arguments that are equally valid regardless of climate.
For BIPV specifically, diffuse light conditions (overcast days) often favor glass-glass BIPV modules over conventional silicon panels because glass-glass construction provides better temperature regulation in high-humidity environments, reducing the thermal performance loss that degrades conventional modules in the same conditions.
Objection 5: “Aren’t There Too Many Technical Risks?”
The response: BIPV is not emerging technology. Commercial BIPV installations have been operating in Europe for 15+ years, with comprehensive performance data published by the IEA PVPS Task 15 technical guidebook. The IEA’s 2025 Technical Guidebook for BIPV documents case studies of installations with over 10 years of operating data, confirming that real-world degradation rates align with the 0.5%/year NREL benchmark and that properly engineered BIPV systems have zero meaningful structural failure rates in the collected dataset.
Quality assurance standards for BIPV are rigorous: IEC 61215 for PV performance, IEC 61730 for electrical safety, and IEC 63092-1 for BIPV-specific combined building material and PV performance requirements. Manufacturer certifications from TÜV Rheinland, SGS, or Bureau Veritas are verifiable through each lab’s online database — providing independent quality assurance that cannot be fabricated.
9. Building Your Interactive Cost-Comparison Tool: Technical Essentials
What Data Inputs Your Tool Must Capture
An effective BIPV cost-comparison tool is the difference between a sales presentation and a sales conversation. The client who interacts with their own data in a live model is far more likely to internalize the results than the client who watches a slideshow.
Required inputs: project location (for automatic solar irradiance data lookup via NREL PVWatts API); building type and primary use (determines applicable incentive programs and energy rate structures); total usable roof/facade area in square feet; existing roofing type and age (to calculate avoided replacement cost); current monthly electricity bill; building ownership horizon (years); federal tax status (whether the client can directly monetize the ITC); and any identified state/utility incentive programs.
System parameters: BIPV product type (roof tile, metal-integrated, glass facade); system size in kW; panel orientation and tilt angle; shading factor from surrounding structures or vegetation.
Key Outputs Your Tool Should Generate
Year-by-year cash flow projections showing: annual BIPV energy production (kWh), annual energy savings value (dollars), incentive cash flows (ITC in year one, MACRS depreciation years 1–5, state/utility incentives by year), annual maintenance costs, and cumulative net cash position versus the traditional roofing + rack solar alternative.
Summary financial metrics: Simple payback period (years), Net Present Value at 7% discount rate (dollars), Internal Rate of Return (%), 25-year total lifecycle cost comparison (BIPV vs. alternative).
Sensitivity analysis: three-scenario model showing 25-year NPV at low (1.5%), base (2.5%), and high (3.5%) electricity rate escalation assumptions. This shows the client that even the conservative scenario produces a positive NPV — and the realistic scenario produces a compelling return.
Design Principles for Maximum Client Engagement
Visual dashboards beat data tables every time. The most effective BIPV comparison tool presents information as a waterfall chart showing cost breakdowns, a line chart showing cumulative net cash position over 25 years, and a bar chart comparing the three financing scenario NPVs side by side. Color-coded output (BIPV cash flow in green, conventional alternative in gray or red) makes the comparison intuitively legible within seconds.
Mobile-responsive design is mandatory. The most valuable moments for using your cost-comparison tool happen during site visits, not at desk presentations. A tool that requires a laptop and a spreadsheet program is a tool that doesn’t get used in the field.
Export functionality — allowing clients to download a professionally formatted PDF report of the scenario they just built — gives them the analysis they need for a board presentation or investor memo without requiring any additional work from your team.
Watch: BIPV Explained — From Cost to ROI in Plain Language

This video walks through how BIPV systems work, why they cost more upfront, and how the full 25-year financial picture justifies the premium — a valuable resource to share with clients who need a visual introduction before your detailed proposal conversation.
10. Your Go-to-Market Strategy: How to Win BIPV Sales
 The BIPV sales conversation that wins is the one where the client sees their own numbers — not a generic pitch. The interactive financial model is your most powerful closing tool. Source: Unsplash
How to Position Yourself as the BIPV Expert in Your Market
Content marketing in the BIPV space requires specificity to be credible. A case study that says “commercial BIPV project achieved excellent ROI” moves no one. A case study that says “5,000 sq ft office building in Atlanta achieved 11.8-year payback with $2.31M in 25-year savings versus conventional roofing” moves developers and architects to call you. Publish specific numbers. Real project data. Actual permit acceleration timelines from your region.
Partnerships with architects, EPC firms, and commercial developers who already specify BIPV are the fastest pipeline development path. An architect who has specified BIPV once — and had a positive experience — becomes an ongoing referral source for every new project they design. Invest in making the specification experience seamless for your architectural partners: provide specification sheets formatted for architectural drawings, compliance documentation pre-packaged for permit submissions, and installation supervision support that removes their execution risk.
The Sales Conversation: From Skeptic to Champion
Open with compliance or aesthetics, not cost. The client who opens with “how much does this cost” is really asking “can you justify this to me.” Don’t answer the cost question first. Answer the underlying question: “Before we talk numbers, let me show you what this eliminates — the roof replacement you’re going to need in year 22, the compliance documentation your permit office will require, and the rental premium your tenants are willing to pay for integrated design.”
Middle of the conversation: Walk through the interactive tool with the client’s actual building data. Let them change the electricity rate escalation assumption. Let them model the C-PACE scenario. The moment a client is manipulating the model themselves — testing their own assumptions against the outputs — they are no longer evaluating your proposal. They are designing their own financial outcome.
Close with the financing option that removes the barrier: For most commercial clients, the C-PACE structure is the close — because it eliminates the upfront capital objection by generating positive cash flow from day one. For clients who can monetize the ITC directly, the cash purchase scenario with year-one tax benefit modeling is the close. Match the financing structure to the client’s specific tax position and capital deployment preferences.
Measuring Success: Metrics That Matter
Track three KPIs to measure your BIPV sales program effectiveness:
Win rate — how often BIPV is specified when formally presented versus when a client chooses an alternative. A win rate below 30% suggests your qualification process is too broad; you’re presenting BIPV to projects that don’t meet the optimal profile. A win rate above 60% suggests you may be under-presenting to qualified opportunities.
Average deal size — BIPV deals should average 2.5–4x larger than conventional rooftop solar deals in equivalent market segments, reflecting both the larger system scope and the integrated building material value. If your BIPV deals are only marginally larger than your conventional solar deals, you’re not fully capturing the building system integration value in your proposals.
Sales cycle time — the interactive cost-comparison tool should measurably shorten the time from first presentation to proposal acceptance. Track the days from first meeting to signed order for BIPV deals with and without the interactive model. The difference is your tool’s quantified contribution to sales velocity.
The Paradox Resolved
BIPV doesn’t cost more. It delivers more — and charges what that delivery is worth.
The architect or developer who rejects BIPV because of the upfront number is making a real decision with real financial consequences: they will replace their roof in 22 years, they will miss the 6-week permit acceleration, they will not capture the rental premium that net-zero certified buildings command, and they will spend 25 years maintaining two separate systems where BIPV would have provided one integrated solution.
Your job is not to argue with the upfront cost. Your job is to show the full picture — the avoided costs, the compliance value, the aesthetic premium, the financing structures that make positive cash flow achievable from day one — until the client can no longer reasonably characterize BIPV as “expensive.”
For product specifications, custom project feasibility, and distributor partnership inquiries, visit Jia Mao BIPV — a 3 GW annual capacity BIPV manufacturer with the full product range to support every application in this guide, from transparent facade glass to metal-integrated roofing panels to complete BIPV system packages. For incentive research, DSIRE provides real-time state incentive data. For permit acceleration and building code requirements, ICC’s net-zero energy resource center and the California Energy Commission’s Title 24 portal are authoritative references.
Call to Action: Take Control of the Conversation
Stop losing BIPV deals to the upfront cost objection. The financial framework, the compliance arguments, and the financing structures in this guide are your toolkit for turning every skeptical architect or developer into a BIPV champion.
For custom ROI analysis for your target market, product specifications from Jia Mao BIPV’s complete product range, and sales enablement support for your team, reach out directly. The deal you’re working on right now is worth running through the 25-year model.
Glossary of Key Terms
| Term | Plain-Language Definition | Example |
|---|---|---|
| BIPV | Building-Integrated Photovoltaics — solar materials that replace conventional building materials (roof, facade, glass) rather than being mounted on top of them | A solar tile that replaces a clay roof tile while generating electricity |
| ITC (Investment Tax Credit) | A direct federal tax credit equal to 30% of eligible BIPV system costs, applied against current-year tax liability | A $400,000 commercial BIPV project earns a $120,000 tax credit |
| MACRS | Modified Accelerated Cost Recovery System — IRS rule allowing solar systems to be depreciated over 5 years instead of 39, generating substantial early tax savings | A commercial BIPV system generates most of its depreciation benefit in years 1–5 |
| C-PACE | Commercial Property Assessed Clean Energy — off-balance-sheet financing repaid through property tax, requiring no personal guarantee | A developer finances a $500K BIPV system with no upfront capital, repaying over 25 years through property tax |
| PPA | Power Purchase Agreement — a third party owns the BIPV system and sells electricity to the property owner at below-market rates | Owner pays $0 upfront; pays $0.10/kWh vs. $0.17/kWh utility rate |
| NPV | Net Present Value — the total value of all future cash flows discounted to today’s dollars | A project with positive 25-year NPV is creating wealth, not just paying back costs |
| IRR | Internal Rate of Return — the annual return rate that makes the NPV of a project equal to zero | BIPV IRR of 13–28% compares favorably to commercial real estate IRR of 7–12% |
| Peak Sun Hours (PSH) | The equivalent daily hours of full 1,000 W/m² solar irradiance — the standard unit for production estimation | Phoenix has 6.0 PSH/day; Seattle has 3.0 PSH/day |
| IEC 63092-1 | The dedicated international BIPV standard requiring modules to simultaneously meet PV performance and building material requirements | A BIPV glass facade must pass both solar performance tests and structural glazing tests |
| Performance Ratio | The fraction of theoretical maximum production that a real system achieves, accounting for all real-world losses | A 0.80 PR means the system produces 80% of its theoretical maximum output |
| VLT | Visible Light Transmission — the percentage of visible daylight that passes through a BIPV glass panel | 30% VLT glass provides partial daylight and generates electricity; 90% VLT is nearly transparent |
| Degradation Rate | The annual percentage decline in a PV module’s output over its lifetime | 0.5%/year means a 100 kW system produces 88 kW at year 25 |
Preguntas frecuentes
FAQ 1: How much more does BIPV cost upfront compared to traditional rooftop solar?
BIPV hardware costs $3,000–$5,000/kW installed versus $1,000–$2,500/kW for rack-mounted rooftop solar (BAPV). That’s a gross premium of 20–100% depending on product type. However, the net cost comparison changes substantially when you account for the roof or facade material that BIPV replaces. BIPV glass-glass modules replacing conventional curtain wall ($50–$120/m²) narrow the net premium significantly. After federal ITC (30%), avoided roofing material cost, and MACRS depreciation, the net effective 25-year cost premium of BIPV over traditional roofing plus rooftop solar is typically 5–15% — not 20–40%. The correct comparison is always net of avoided building material costs and applicable incentives.
FAQ 2: What is the realistic payback period for a BIPV system in 2025?
Commercial BIPV projects in good solar climates with the full ITC and MACRS depreciation achieve payback in 8–12 years. Residential multi-family projects typically see 10–15 years. However, the payback period metric understates BIPV’s financial case — it ignores the 13–15 additional years of pure revenue generation after payback, the roof replacement costs BIPV eliminates, and the property value appreciation it generates. For a complete financial picture, always model 25-year NPV and IRR alongside simple payback. BIPV’s 25-year NPV typically exceeds that of conventional rooftop solar by 30–50% when all system benefits are included.
FAQ 3: Can BIPV be financed without a large upfront investment?
Yes — multiple structures achieve near-zero or zero upfront cost. C-PACE financing (available in 40+ states) provides 100% project financing repaid through property tax assessment, with no personal guarantee, at 7.0–8.5% over 10–30 years. Annual C-PACE payments on a typical commercial BIPV project are structured to be lower than annual energy savings from day one in most good solar markets. PPAs provide zero-upfront-cost deployment by shifting ownership to a third-party investor. Green bonds and ESG-linked commercial mortgages with sustainability performance incentives are growing rapidly as an institutional financing option. For most commercial clients, the choice is not whether to finance BIPV — it’s which structure optimizes their tax position and cash flow profile.
FAQ 4: Does BIPV generate as much energy as conventional rooftop solar?
Roof-integrated BIPV systems (metal panels, solar tiles) perform comparably to rooftop solar — typically within 5–10% of a rack-mounted system at identical orientation and tilt. Facade-integrated BIPV produces less per module due to the vertical installation angle (south facades average 60–70% of rooftop production), but this is compensated by the additional usable surface area that vertical facades provide. The critical point: BIPV and rooftop solar are different tools. A 2025 analysis of 120 global cities found average facade PV potential of 68.2% of rooftop potential — meaning a building with both a roof and a south facade that deploys BIPV on both surfaces produces significantly more total energy than rooftop solar alone could generate.
FAQ 5: What building codes require or incentivize BIPV in 2025?
California’s 2025 Title 24 standards (effective January 2026) require commercial new construction to include both PV systems and battery storage, with BIPV explicitly recognized as a compliant installation pathway. New York State Energy Code mandates greenhouse gas intensity targets for new commercial buildings above 25,000 sq ft that effectively require on-site renewable generation. The 2021 International Energy Conservation Code (IECC) allows BIPV to satisfy on-site renewable requirements in jurisdictions that have adopted it. In many historic districts and aesthetically controlled zoning areas across major US cities, BIPV is not just incentivized — it’s the only permissible solar installation path. For current jurisdiction-specific code requirements, the ICC’s net-zero energy resources y SEIA’s building code update tracker are authoritative current sources.
FAQ 6: How long do BIPV systems last, and what warranties do manufacturers provide?
BIPV modules from certified manufacturers carry 25-year performance warranties (guaranteeing 80%+ of rated output at year 25) and 25-year product warranties covering manufacturing defects. Some manufacturers — including Jia Mao BIPV — provide 25-year structural integrity warranties on laminated glass products and 20-year security rating maintenance guarantees for high-security applications. The NREL-confirmed degradation rate of 0.5%/year for crystalline BIPV modules means that 88% of original output is maintained at year 25. As the module is the building envelope, its functional life as a building component extends beyond the power production warranty — the glass remains a weather barrier for the 40+ year life of the building.
FAQ 7: What maintenance is required, and how much does it cost?
Commercial BIPV systems require: annual cleaning ($500–$2,000/year depending on size and local soiling conditions — reduced by 30% for systems with anti-fouling coatings), annual visual inspection and production data review ($500–$800/year), and inverter replacement at approximately year 10–15 ($8,000–$15,000 for commercial string inverter systems). Total annual BIPV maintenance: approximately $0.01–$0.02/W, or $1,000–$2,000/year for a 100 kW system. Compare this to conventional commercial roofing maintenance of $0.08–$0.15/sq ft annually ($5,000–$8,500/year for 5,000 sq ft) plus the full roof replacement cost at year 20–25. The 25-year maintenance cost advantage of BIPV over conventional roofing typically exceeds $200,000 on a 5,000 sq ft commercial building — a figure that belongs in every lifecycle cost comparison.
FAQ 8: Are there tax incentives specifically available for BIPV versus conventional solar?
BIPV qualifies for all the incentives available to conventional solar, plus some additional benefits. The federal ITC at 30% applies equally. MACRS 5-year accelerated depreciation applies to the solar component. What BIPV may additionally qualify for: domestic content bonus adder (if components are US-manufactured), energy community bonus adder (for qualifying locations), and certain state programs that specifically recognize building-integrated systems for enhanced incentive eligibility. In some jurisdictions, BIPV qualifies for historic preservation grants or architectural integration incentives that conventional rooftop solar does not. Always verify current state-specific incentive eligibility through DSIRE and confirm ITC applicability for your specific system configuration with a qualified tax advisor.
FAQ 9: How does BIPV help meet building code compliance requirements?
BIPV is uniquely positioned as a multi-compliance solution. It satisfies: on-site renewable generation requirements (mandatory in California 2026, New York, and Massachusetts for most new commercial buildings); cool roof standards (BIPV thermal mass reduces roof surface temperature contribution to urban heat island); aesthetic restrictions in design-controlled zones; and energy use intensity targets by producing electricity that directly offsets the building’s consumption. The compliance advantage that is most often overlooked: BIPV qualifies many projects for expedited permitting review (saving 4–8 weeks of permit timeline) and for density bonuses in some jurisdictions that allow additional buildable floor area in exchange for integrated renewable energy systems. For a developer, a density bonus worth one additional unit of rentable space may alone justify the BIPV premium.
FAQ 10: Will BIPV increase resale or rental value?
Yes, with documented data to support specific claims. Lawrence Berkeley National Laboratory analysis confirms solar installations add $4.00–$5.00/W to commercial property values — meaning a 250 kW commercial BIPV system adds $1.0–$1.25 million to property value at appraisal. For multi-family residential, the 3–8% sale price premium for solar-integrated buildings in premium markets translates to $54,000–$144,000 in additional sale value on a $1.8 million property. Rental premium data from CBRE and JLL confirm a 5–7% premium for net-zero certified commercial space in major US markets. These are not projections — they are observed transaction data from markets where BIPV-equipped buildings have traded. For your specific market, pull three to five recent comparable sales as customized evidence for your clients.
FAQ 11: What if the building is shaded or in a cloudy climate?
Modern BIPV systems are optimized for diffuse light conditions — glass-glass construction and advanced cell technologies (bifacial cells, half-cut cells, multi-busbar architecture) reduce the performance penalty from non-ideal irradiance conditions versus conventional rooftop solar. In climates with significant cloud cover (Seattle, Portland, the UK), BIPV systems designed with appropriate system sizing and orientation still generate meaningful energy value while delivering the full compliance, aesthetic, and lifecycle cost benefits that are independent of solar output. The NREL PVWatts calculator provides location-specific production estimates that can be incorporated directly into your client proposals — always present shaded or cloudy-climate scenarios with third-party production modeling, not manufacturer-stated ratings, to maintain credibility.
FAQ 12: How do I compare BIPV costs across different vendors and system types?
Normalize all comparisons to the same base: installed $/W (including materials, labor, engineering, compliance documentation, and BOS) after ITC, and net of avoided conventional building material cost. Request itemized cost breakdowns from every vendor — not just a lump-sum installed price. Verify certifications through the testing lab’s own database (not just vendor-supplied documents). Confirm warranty terms are in writing, with the financial entity backing the warranty identified. For product-type comparison across BIPV options (solar tiles, metal-integrated, glass facade), the Jia Mao BIPV product comparison guide and the IEA PVPS BIPV Technical Guidebook provide the most comprehensive independent reference data currently available.
For full BIPV product specifications, custom project feasibility analysis, and distributor partnership inquiries, visit www.jmbipvtech.com. For ITC and MACRS guidance, consult SEIA’s tax policy resources. For state incentive research, DSIRE is the definitive database.


-300x300.jpg)