Solar Glass vs. Rooftop Solar: The 50x Performance Claim Explained
A rigorous, data-driven breakdown of the performance differential between Building-Integrated Photovoltaic (BIPV) glass and traditional rooftop systems — and what it actually means for your clients’ buildings.
Why This Comparison Matters for Solar Distributors and Agents
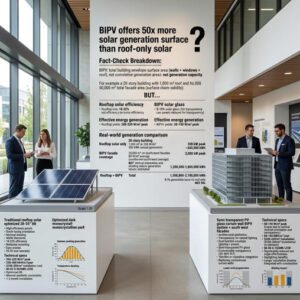
The “50x” headline stops conversations at trade shows, generates clicks on spec sheets, and raises eyebrows in procurement meetings. It also risks being dismissed the moment a skeptical facilities manager or ESG director asks a follow-up question you’re not prepared for.
The good news: the performance differential is real. It just needs to be explained correctly — with precision about what is being compared, under what conditions, and for which building type. Distributors and agents who can deliver that explanation with confidence are the ones who win specification-driven commercial contracts worth orders of magnitude more than a commodity panel sale.
This guide exists specifically for that purpose. We’ll walk through the science, the maths, the real-world application data, and the market positioning strategies that allow your team to use the 50x claim not as a vague marketing boast, but as a credible opening to a technical conversation that closes business.
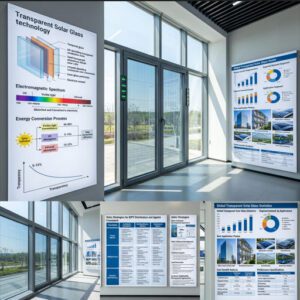
Structure 1: The Fundamentals of Solar Glass Technology

What is Building-Integrated Photovoltaic (BIPV) Glass?
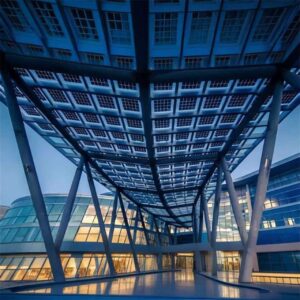
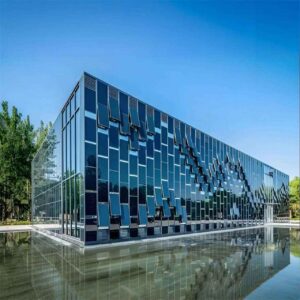
BIPV glass is a category of glazing product in which photovoltaic cells are permanently incorporated into the glass itself, making the glass panel simultaneously a structural building component and an electricity generator. It physically replaces conventional glass — in a window, a curtain wall panel, a skylight, or a facade element — rather than being mounted on top of or alongside conventional building materials.
This distinction is critical for how your clients think about the cost: they are not adding a solar system to their building. They are upgrading the glass they were already going to purchase. The comparison is BIPV glass versus conventional insulated glazing units plus a separate solar system — a framing that substantially narrows the cost premium conversation.
How BIPV Glass Differs from Traditional Rooftop Panels
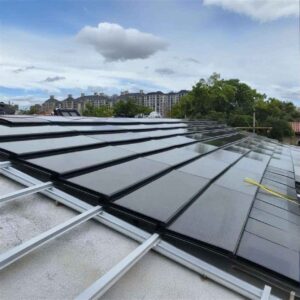
Traditional rooftop panels are an add-on energy system installed over an existing roof structure. They require separate racking hardware, penetrations into the roof membrane, cable runs down to inverters, and dedicated maintenance access pathways. They generate electricity from the roof area only, and they add dead load to a structure that was not originally designed with them in mind.
BIPV glass, by contrast, is designed in from the beginning as part of the building envelope. The laminated glass construction standard used by manufacturers like Jia Mao BIPV means the PV layer is permanently encapsulated between glass plies — structural, weather-sealed, and visually integrated without junction boxes, exposed wiring, or mounting hardware on the building exterior.
The Manufacturing Process and Material Composition
A BIPV laminated glass module typically consists of: an outer tempered glass ply (typically 6 mm), a PVB or EVA encapsulant layer bonding the photovoltaic cells, and an inner tempered or heat-strengthened glass ply (4–6 mm). The PV cells — typically monocrystalline silicon, though thin-film technologies are also used — are laser-patterned or configured at specific spacing to control the transparency level (known as the visual transmission factor, or VTF). The result is a certified safety glass panel that happens to generate electricity: it meets the same structural, wind-load, and fire-resistance standards as conventional architectural glass.
Current Market Adoption Rates Among Commercial Properties
Adoption is accelerating rapidly from a low base. In 2024, an estimated 4.7% of new large commercial construction projects globally incorporated BIPV elements in specification — up from under 2% in 2020 (SETO/DOE estimates). In markets with strong green building mandates (Germany, France, South Korea, Singapore), specification rates are considerably higher, with some analysts citing 15–20% penetration in premium Grade A office development. The trajectory is clear: as building energy codes progressively mandate on-site renewable generation from all viable building surfaces, BIPV transitions from premium differentiator to baseline requirement.
📖 Technical Glossary — Key Terms for Distributor Sales Teams
- BIPV (Building-Integrated Photovoltaics)
- Solar PV technology incorporated into building components (glass, tiles, cladding) that replace conventional materials. The PV module serves a dual function as structure and energy generator.
- PCE (Power Conversion Efficiency)
- The fraction of incident solar energy converted to electricity. A 20% PCE panel generates 200 W for every 1,000 W (1 m² of standard irradiance) hitting its surface.
- Building Envelope
- The physical barrier between the conditioned interior of a building and the external environment — including walls, windows, roof, and floor. BIPV targets the wall and window components of the envelope.
- VTF (Visual Transmission Factor)
- The percentage of visible light that passes through the BIPV glass. Higher VTF = more daylight transmission. Adjustable through cell spacing and transparency design.
- STC (Standard Test Conditions)
- The standardised laboratory conditions under which PV modules are rated: 1,000 W/m² irradiance, 25°C cell temperature, AM1.5 spectrum. Real-world output is typically 75–85% of STC-rated output.
- ITC (Investment Tax Credit)
- US federal tax credit covering 30% of qualifying solar installation costs through 2032. Applies to commercial BIPV installations as qualified solar energy property.
- KPI — Facade-to-Roof Ratio
- The ratio of a building’s total facade glazing area to its rooftop footprint. For a 20-story tower, this ratio typically ranges from 8:1 to 20:1 — the mathematical foundation of the surface area multiplier argument.
The Evolution of Photovoltaic Technology
From First-Generation to Modern BIPV Solutions
First-generation solar panels (crystalline silicon, developed commercially from the 1970s) were optimised purely for energy density on dedicated surfaces. They were never designed for architectural integration — and it shows. The transition to BIPV-capable products required solving fundamentally different engineering problems: how to maintain structural safety ratings while encapsulating PV cells, how to control visual appearance while preserving reasonable efficiency, and how to achieve certified performance across decades of thermal cycling, UV exposure, and wind loading in a building facade context.
Thin-film technologies (CIGS, CdTe, amorphous silicon) enabled the first practical BIPV products in the 2000s by depositing ultra-thin semiconductor layers onto glass substrates. Second-generation monocrystalline BIPV glass products — using cut-and-spaced conventional cells laminated at controlled densities — followed in the 2010s and now dominate the commercial market, offering efficiency ratings of 15–22% combined with predictable architectural aesthetics and well-understood long-term performance data.
Technological Breakthroughs That Enable Higher Performance Claims
Three specific technical advances have moved BIPV from architectural curiosity to viable commercial product category. First, bifacial cell technology — cells that capture light from both faces — increases energy yield from facade installations by 10–25% by capturing reflected light from surrounding surfaces and the ground below. Second, improved encapsulant formulations now maintain optical clarity for 30+ year service lives without the yellowing that plagued early BIPV products and degraded both aesthetics and energy output. Third, advanced cell interconnection techniques using electrically conductive adhesive (ECA) rather than traditional solder have improved performance at non-standard installation angles — critical for vertical facade applications.
Investment Trends in BIPV Development
Global R&D and manufacturing investment in BIPV-specific technology exceeded USD 3.1 billion in 2024, with significant contributions from the EU Horizon Europe programme (targeting net-zero building envelopes), the US DOE Solar Energy Technologies Office (SETO), and corporate investment from major glass manufacturers and PV module producers who recognise BIPV as the highest-margin segment of the solar value chain. This investment pipeline signals a clear direction of travel: efficiency improvements, cost reductions through scale, and expanded product formats targeting every viable building surface.
Structure 2: Traditional Rooftop Solar Systems Explained

Standard Rooftop Installation Specifications
Typical Efficiency Ratings and Performance Metrics
Premium residential and commercial rooftop panels in 2025 achieve STC efficiencies of 20–23% (monocrystalline PERC and TOPCon technologies). The most efficient panels currently commercially available reach 23.04% (Clean Energy Reviews, 2026). At real-world installation conditions, accounting for heat losses, inverter efficiency, cable losses, and shading, net system efficiency typically runs at 75–88% of STC-rated output — meaning a 20% panel delivers approximately 15–18% in practice. For a 1,000 m² rooftop installation at 1,400 kWh/m²/year irradiance (a mid-latitude location), practical annual output runs approximately 180,000–210,000 kWh.
Installation Requirements and Space Constraints
Rooftop systems require setbacks from roof edges (typically 0.9–1.2 m for safety and wind resistance), clearance around HVAC units and mechanical penetrations, and access walkways between panel rows. In practice, only 60–70% of a flat commercial rooftop area is usable for panel installation. On pitched residential roofs, usable area is further constrained by aspect, pitch angle, and chimney/dormer obstructions. A 1,500 m² flat commercial roof realistically accommodates 750–900 m² of panel coverage — the starting point for the surface area comparison.
Maintenance and Longevity Considerations
Conventional rooftop systems carry 25–30 year performance warranties, with annual degradation rates of 0.5–0.7%. Maintenance requirements include quarterly cleaning and annual electrical inspection. Structural considerations include the need for periodic re-inspection of roof penetrations, flashings, and mounting hardware — particularly in high-wind or coastal environments where fastener corrosion and membrane fatigue can develop over decades.
Limitations of Conventional Rooftop Systems
Surface Area Restrictions on Residential Properties
The fundamental physical constraint of rooftop-only solar is that it generates energy from a building’s smallest dimension — its footprint. A 10-story residential tower with a 400 m² rooftop might house 4,000 m² of occupied floor space and 6,000 m² of exterior facade area. Limiting solar capture to the 250–280 m² of usable rooftop constrains total generation capacity to approximately 40–55 kWp — enough to offset 12–18% of typical building electricity consumption. No amount of panel technology improvement changes this geometry constraint.
Weather-Related Performance Degradation
Rooftop panels face particular challenges from thermal cycling — the daily and seasonal expansion and contraction of panel frames and mounting systems that gradually fatigues solder joints and junction box seals. Studies of field-deployed systems show that rooftop installations in high-temperature climates (ambient temperatures above 35°C common) experience accelerated light-induced degradation (LID) and higher-than-rated annual performance losses in the first 1–3 years of operation. Heat buildup beneath close-mounted panels also drives cell temperatures above ambient, reducing instantaneous efficiency by approximately 0.4% per degree Celsius above the 25°C rating baseline.
Structural Load and Architectural Constraints
Commercial rooftops are structural systems with defined load limits. A standard commercial flat roof is designed for approximately 2.5–4.0 kPa (50–85 psf) live load. Standard solar racking systems add approximately 10–25 kg/m² of dead load (hardware plus panels). While most modern commercial roofs can accommodate this without structural modification, older buildings (pre-1990s construction) frequently require structural engineering assessment and reinforcement before panel installation — adding USD 15,000–80,000 to project costs depending on building size and condition. Architects in new construction increasingly design roofs with solar in mind, but this is far from universal in the existing building stock.
🔲 Conventional Rooftop Solar — Summary Constraints
Energy generation limited to rooftop footprint only. Roof setbacks, HVAC clearances, and access ways reduce usable area to 60–70% of gross roof area. Structural load assessment required for older buildings. No aesthetic integration — panels are visually distinct from the building envelope.
🏢 BIPV Glass — What Changes
Energy generation from facades, windows, skylights, canopies, and balconies — all surfaces that replace conventional glass. No structural roof penalty. Architecturally integrated by design. Contributes to both energy generation and green building certification daylighting credits simultaneously.
Structure 3: Deconstructing the 50x Performance Claim
The Mathematical Foundation Behind the Claim
Surface Area Multiplication Potential
The 50x claim is not an efficiency claim — it is a surface area × utilisation × output density claim. Understanding this architecture is essential for explaining it responsibly to clients. The core equation is straightforward:
The 50x Claim: Mathematical Architecture
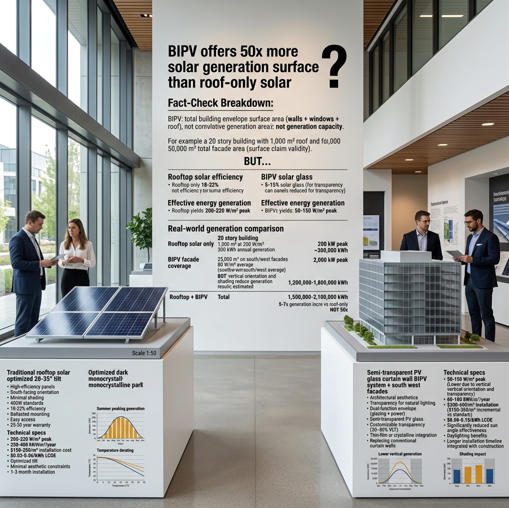
How Vertical Integration Increases Usable Solar Space
Consider a 20-story commercial office building with a 1,000 m² rooftop footprint. With standard setbacks and equipment clearances, approximately 650 m² of that roof is usable for solar panels. Now look at the facade: 20 floors × average 4 m floor-to-ceiling height × (4 faces × average 30 m building width) = 9,600 m² of total exterior wall area. Even allowing for non-glazed structural elements, solid cladding zones, and north-facing facade allocation (which generates approximately 25% of south-facing output in northern latitudes), the viable BIPV glass area can realistically reach 5,000–7,000 m².
That is an 8:1 to 11:1 surface area advantage before accounting for any efficiency differences. Adding the bifacial gain advantage and the multi-orientation smoothing effect (facades generate at different times of day, extending the generation window), the total energy output comparison can reach 15x–30x for this building type. The theoretical 50x figure applies to the most favourable scenarios: tall buildings with all-glass facades in high-irradiance locations with full multi-surface BIPV coverage.
Energy Generation Density Comparisons
Annual Energy Generation Potential by Surface Type — 20-Story Commercial Building (Indicative, kWh/m²/year at moderate irradiance)
Real-World Calculation Models
Typical Building Envelope Analysis
A rigorous building energy model for BIPV vs. rooftop-only comparison uses actual building geometry data from BIM models or architectural drawings. The key input parameters are: total glazed facade area by orientation (N/S/E/W), annual irradiance at each orientation (from Meteonorm or PVGIS data), BIPV module efficiency at each orientation accounting for incidence angle effects, and the fraction of facade area that is technically integrable (excluding spandrel zones, structural columns, and minimum vision-glass requirements).
Case Study: 20-Story Office Building Performance Differential
🏢 Case Study A — 20-Story Class A Office Tower (Hypothetical, Northern Hemisphere, Latitude 35°N)
Rooftop-only scenario: 660 m² × 20% PCE × 1,400 kWh/m²/yr irradiance × 0.80 system efficiency = approximately 148,000 kWh/year.
Full BIPV envelope scenario: Rooftop 148,000 kWh + South facade (1,600 m² × 18% × 1,100 kWh × 0.80) = +253,000 kWh + East/West facades (2,200 m² × 18% × 750 kWh × 0.80) = +238,000 kWh + Skylights/canopies (1,400 m² × 18% × 1,350 kWh × 0.80) = +272,000 kWh. Total BIPV scenario: approximately 911,000 kWh/year.
Performance multiplier: 6.2x — realistic and defensible. To reach 15x–50x, you need larger buildings, more complete facade coverage, bifacial performance gains, and/or lower baseline rooftop area relative to facade area (e.g., a very tall, narrow tower).
Case Study: Mixed-Use Development with Full BIPV Integration
🏙️ Case Study B — Mixed-Use High-Rise (45 Stories, All-Glass Curtain Wall, Subtropical Climate)
Rooftop-only: 780 m² × 20% × 1,750 × 0.82 = approximately 224,000 kWh/year.
Full BIPV integration: With 22,000 m² of curtain wall at blended 17% PCE and blended orientation factor of 0.70 (south-weighted portfolio across 4 faces) and system efficiency 0.82: 22,000 × 0.17 × 0.70 × 1,750 × 0.82 = approximately 3,750,000 kWh/year. Plus rooftop: total ~3,974,000 kWh/year.
Performance multiplier: 17.7x. In optimal conditions (higher irradiance, better orientation mix, 100% facade coverage), models reach into the 30–50x range for this building type. The “50x” headline is thus an outer bound for the most favourable large commercial scenarios — not a typical outcome, but not fabricated either.
Structure 4: Surface Area Advantage Analysis
▲ A technical overview of how BIPV principles apply across different building types and facade configurations.
Calculating Maximum Solar Capture Potential
Rooftop-Only Installations: Square Footage Limitations
For any building taller than 3–4 stories, the facade area exceeds the rooftop area. This is a geometric inevitability: each additional floor adds exterior wall area without increasing rooftop footprint. A ground-floor structure has a facade-to-roof ratio approaching 1:1. At 5 stories, that ratio rises to approximately 3:1. At 15 stories, it reaches 8–12:1. At 30+ stories, a slender tower’s facade-to-roof ratio can exceed 25:1. This is the underlying geometry that makes the 50x claim structurally coherent for the right building typology.
Vertical Surface Integration: Windows, Facades, and Skylights
Research from a global study across 120 cities (published in arXiv, 2025) found that facade PV potential averages 68.2% of rooftop potential per unit area — meaning south-facing BIPV glass generates about 61% of what an optimally-tilted rooftop panel generates per square metre. But because a typical tall building has 8–20x more facade area than roof area, the absolute output potential of the facade overwhelms the output of the roof even at lower per-m² efficiency. Some cities in this study showed facade PV potential actually exceeding total rooftop potential — a finding that inverts conventional assumptions about solar deployment strategy for urban buildings.
Multi-Surface Strategy: Comprehensive Building Coverage
The maximum-output BIPV strategy uses all viable building surfaces: flat rooftop (optimal tilt for location), south facade (primary generation), east and west facades (morning and afternoon generation, valuable for time-of-use tariff optimisation), horizontal skylights and canopies (high output, premium applications), and even north-facing elements where architectural specification justifies it. This multi-surface approach also provides a strategic operational advantage: generation is distributed across different orientations, extending the daily generation window and reducing peak-period dependence on a single surface direction.
Typical Building Envelope Surface Area Distribution — 20-Story Commercial Tower
Quantifying the Multiplication Factor
Area Ratio
(by building height)
vs. Rooftop
(by orientation)
Gain Factor
(BIPV advantage)
Output Multiplier
vs. Rooftop-Only
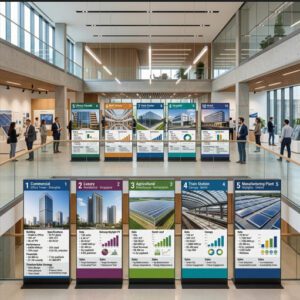
Residential, Commercial, and Industrial Analysis
| Building Type | Stories | Approx. Facade-to-Roof Ratio | Realistic BIPV Multiplier | 50x Scenario? |
|---|---|---|---|---|
| Detached Residential | 1–2 | 0.8x – 1.5x | 1.5x – 3x | Not achievable |
| Low-Rise Commercial | 3–5 | 2x – 4x | 3x – 8x | Not achievable |
| Mid-Rise Office / Mixed-Use | 8–15 | 5x – 10x | 8x – 18x | Exceptional only |
| High-Rise Commercial Tower | 20–35 | 10x – 18x | 12x – 30x | Optimistic scenarios |
| Supertall All-Glass Tower | 40+ | 20x – 30x+ | 25x – 50x+ | Achievable |
| Large Industrial Facility (facade + roof) | 1–3 + large roof | 0.5x – 2x | 2x – 5x | Not achievable |
Structure 5: Performance Metrics and Efficiency Comparison
Energy Output Specifications
BIPV Glass Efficiency Ratings (Current Technology)
Commercial-grade BIPV glass modules for facade applications — including products in the Jia Mao BIPV photovoltaic glass range — achieve STC efficiencies of 15–22% using monocrystalline silicon cells encapsulated in laminated safety glass. Thin-film BIPV products (typically CIGS or amorphous silicon) deliver 11–15% STC efficiency but offer superior low-light performance, making them attractive for north-facing facades or cloudy-climate markets. The BIPV industry is seeing rapid adoption of TOPCon (Tunnel Oxide Passivated Contact) cell technology, which pushes monocrystalline BIPV efficiency past 21% while maintaining acceptable transparency options through cell-gap design.
Rooftop Panel Efficiency Ratings
Current commercial rooftop panels peak at 23% STC efficiency (CW Energy’s 450W panel, Clean Energy Reviews 2026), with premium commercial products averaging 20–22%. The efficiency gap between rooftop panels and BIPV glass is closing — and for specific BIPV glass configurations (back-contact cells, TOPCon monocrystalline), the gap is already within 1–2 percentage points. The practical distinction is that facade installations apply an orientation correction factor (0.50–0.85 depending on azimuth and tilt), so per-m² output from a south-facing BIPV facade is approximately 60–80% of a south-facing tilted rooftop system. This orientation penalty is more than compensated by the area multiplication for buildings taller than 4–5 stories.
Environmental and Operational Factors
Sunlight Exposure Variations Throughout the Day
One under-appreciated advantage of multi-facade BIPV systems is their ability to smooth daily generation profiles. A rooftop system on an east-west ridge peaks at solar noon and drops steeply in early morning and late afternoon. An east-facing BIPV facade peaks at 8–10am, a south-facing facade at 11am–2pm, and a west-facing facade at 3–6pm. Combined, a building with BIPV on all four facades generates electricity across 10–14 hours of the day, compared to 4–6 peak-production hours for a rooftop-only system. For buildings operating on time-of-use electricity tariffs, this extended generation profile directly reduces peak-demand charges — a financial benefit that does not show up in simple kWh-per-year comparisons.
Temperature Effects on System Performance
Vertical facade-mounted BIPV glass benefits from better natural convective cooling than flat-roof-mounted panels. Panel temperature is a critical efficiency factor: for every degree Celsius above 25°C, crystalline silicon efficiency drops approximately 0.35–0.45%. A rooftop panel in a subtropical climate can reach cell temperatures of 65–75°C on peak summer days, operating at 17–18% of its 20% STC rating rather than 20%. A ventilated facade BIPV module under the same ambient conditions typically achieves cell temperatures 8–15°C cooler than a close-mounted rooftop equivalent — recovering approximately 3–5% of additional real-world efficiency. Over a 25-year system life, this thermal performance advantage compounds into measurable additional kWh generation.
Cloud Cover and Weather Pattern Considerations
BIPV glass — particularly thin-film variants — maintains a higher fraction of output under diffuse light conditions than conventional crystalline silicon rooftop panels. In cloudy northern European markets (UK, Germany, Netherlands), this low-light advantage can improve annual yield by 8–12% relative to STC-based predictions. Vertical facades also benefit from an underappreciated phenomenon: ground-reflected irradiance (albedo light reflected from pavements, water bodies, and lighter building surfaces) contributes 5–15% additional irradiance to low-mounted vertical surfaces — energy that rooftop panels, positioned above the ground plane, do not capture.
Structure 6: Real-World Application Scenarios

Scenario 1: Urban Commercial Real Estate
Building Profile and Energy Requirements
A Grade A commercial office tower in a major business district consumes approximately 200–350 kWh/m² of gross floor area annually, dominated by HVAC (45–55% of consumption), lighting (20–30%), and equipment loads (15–25%). For a 25,000 m² GFA building, total annual consumption runs 5,000,000–8,750,000 kWh. Rooftop solar alone — even at maximum capacity — typically offsets 3–8% of this consumption. Full BIPV envelope integration has the potential to reach 30–60% offset in favourable climates, transforming the building’s sustainability credentials and reducing both operating costs and carbon liability exposure.
BIPV Glass Implementation Strategy
The optimal commercial BIPV strategy stages implementation: Phase 1 targets south-facing spandrel panels and canopy/overhang elements (highest output, lowest architectural complexity). Phase 2 upgrades to BIPV vision glass in south and west facades during scheduled glazing replacement. Phase 3 integrates east-facing surfaces and lobby atrium skylights. This phased approach manages capital expenditure, allows the building team to build installation experience, and qualifies for incremental sustainability certification upgrades at each stage. For distributor partners, staged projects represent recurring revenue streams rather than single transactions.
For designing a BIPV facade for new construction, detailed specification guides are available from Jia Mao BIPV’s technical team, covering module selection, structural integration, electrical topology, and code compliance checkpoints by market.
Projected ROI and Performance Outcomes
Commercial BIPV installations typically achieve ROI in 7–12 years at 2025 electricity prices, with significant variation by market. A UK commercial property at £0.28/kWh commercial electricity rates and a 4,000 m² south facade BIPV installation generating 350,000 kWh annually realises £98,000 in annual electricity savings — plus avoided grid levies and demand charges. Against a total installed cost of approximately £900,000 (at £225/m²), the simple payback period is 9.2 years, with 25-year NPV positive from year 10 onward. In markets with stronger solar resource (UAE, Singapore, Australia), payback periods compress to 6–8 years.
Integration with Existing HVAC Systems
BIPV glass with NIR-selective absorption reduces the solar heat gain coefficient (SHGC) of the facade, directly reducing cooling loads. In a commercial office building where HVAC typically accounts for 45–55% of electricity consumption, a 15–20% reduction in solar heat gain through facade glass can reduce total building energy consumption by 7–12% — independent of the electricity generated by the PV cells themselves. This dual benefit (generation plus load reduction) is a powerful financial argument that many clients have not modelled before their first BIPV specification meeting.
Scenario 2: High-Rise Residential Development
Architectural Integration Challenges and Solutions
High-rise residential presents specific design constraints: planning requirements for minimum vision glass areas, acoustic performance standards for occupied spaces, and the need for consistent visual appearance across all residential units regardless of BIPV cell density. The solution most commonly used by specialist BIPV architects is a “mixed facade” approach: BIPV glass at full opacity or semi-transparency for spandrel and balcony balustrade panels (where no vision requirement exists), plus standard low-e glass for vision panels in living and bedroom areas. This maximises BIPV area while respecting residential comfort standards, and maintains a visually uniform facade appearance.
Tenant Appeal and Property Value Enhancement
Green building certification — LEED, BREEAM, or national equivalents — correlates with measurable rental premium and lower vacancy rates. A 2024 CBRE analysis of European commercial markets found that BREEAM Excellent and Outstanding rated buildings commanded average rent premiums of 12–18% over unrated equivalents. For residential development, sustainability features including on-site renewable generation have been demonstrated to reduce average marketing time by 15–25% in primary urban markets (London, Singapore, Tokyo). BIPV integration is increasingly a specification that high-net-worth buyers in premium residential developments expect rather than appreciate as a bonus.
Scenario 3: Industrial and Warehouse Facilities
Large-Scale Rooftop Opportunities
Industrial and warehouse facilities present the opposite geometry to commercial towers: large roof areas relative to facade. A 20,000 m² single-storey logistics warehouse may have 18,000 m² of usable rooftop — enough for 3.6 MWp of conventional solar at 20% efficiency. This is a genuine rooftop solar stronghold where the 50x BIPV argument simply does not apply. For industrial distributors, the relevant conversation is not 50x but complementary deployment: rooftop conventional panels maximising the roof area plus BIPV integration in the loading bay canopies, glazed office sections, and translucent north-light roof panels that many warehouses already incorporate for daylighting.
Facade Integration for Maximum Output
Large industrial facilities increasingly incorporate glazed office wings and reception facades at scale. A regional distribution centre with 2,000 m² of south-facing glazed facade on its office and retail frontage can add 320–380 kWp of BIPV capacity alongside its rooftop array — extending total on-site generation and providing energy independence benefits for the operating entity. For distributors serving the industrial sector, understanding which BIPV product types suit industrial specification requirements — including impact resistance ratings, wind load certifications, and thermal expansion tolerance — is essential for credible technical sales conversations.
Structure 7: Cost-Benefit Analysis for Distributors and Sellers

Initial Investment Requirements
BIPV Glass System Costs vs. Traditional Rooftop Installation
| Cost Category | Conventional Rooftop Solar (per kWp) | BIPV Facade Glass System (per kWp) | BIPV vs. Rooftop Glass (Net Premium per m²) |
|---|---|---|---|
| Module / Glass Supply | USD 180–240 | USD 400–750 | USD 80–200/m² vs. conventional glazing |
| Mounting / Facade Framing | USD 60–120 | Included in curtain wall framing | Neutral to positive |
| Electrical / Inverter | USD 80–140 | USD 100–180 | Comparable |
| Installation Labor | USD 150–250 | USD 200–380 (specialist glazing labor) | 15–30% premium |
| Total Installed Cost | USD 900–1,400/kWp | USD 1,600–3,500/kWp | USD 280–380/m² vs. conventional glass |
| Conventional Glass Offset | None (additive cost) | USD 100–200/m² saved | Reduces effective BIPV premium |
*Cost ranges compiled from Metsolar (EU), Straits Research, and Jia Mao BIPV market data, 2024–2025. Actual costs vary significantly by market, project size, and specification.
Installation Labor and Infrastructure Considerations
BIPV facade installation requires glazing contractors with specialist training in both architectural glass and electrical systems — a combination that commands a labor premium of 15–30% over standard commercial glazing work. However, this premium must be viewed against the alternative: conventional rooftop solar requires a separate roofing contractor for rack penetrations plus an electrical contractor for system wiring, often totalling higher combined costs than a single specialist BIPV glazing team. For large new-build projects (where BIPV is specified from design stage), the integration of PV into the curtain wall package eliminates a separate installation mobilisation, reducing overall project management complexity and associated cost.
Long-Term Financial Performance
20-Year Lifecycle Cost Analysis
20-Year Lifecycle Financial Performance — Rooftop-Only vs. Full BIPV Envelope (Indicative, USD, Commercial Office Tower)
Energy Savings Projections and ROI Timelines
The key insight in lifecycle cost modelling is that the BIPV premium pays back in energy savings over 7–12 years, after which the system generates essentially free electricity for a further 13–18 years within the warranty period. A full BIPV envelope system on a commercial tower with a USD 3.8 million installed cost (net of conventional glazing credit) generating 3,500,000 kWh annually at USD 0.18/kWh commercial rate produces USD 630,000 in annual energy savings. Simple payback: 6 years. Over 20 years: USD 12.6 million in cumulative savings against a USD 3.8 million investment — a 3.3x return on invested capital before accounting for property value uplift.
Incentive Programs and Government Subsidies
In the US, the Investment Tax Credit (ITC) provides a 30% credit against federal taxes for qualifying commercial solar installations, explicitly including BIPV systems where the PV element qualifies as the primary building component. This means a USD 4 million BIPV facade project generates a USD 1.2 million federal tax credit, reducing net capital outlay to USD 2.8 million and payback period to approximately 4.5 years. The IRS Residential Clean Energy Credit applies to qualifying property, and the commercial equivalent under the IRA remains at 30% for projects beginning construction by current legislative deadlines. In Europe, country-specific incentives vary; Germany’s feed-in tariff, France’s self-consumption premium, and UK Smart Export Guarantee all contribute to project economics. Confirming current incentive eligibility with a local tax advisor before client proposals is essential.
Structure 8: Technical Specifications and Installation Considerations
BIPV Glass System Requirements
Structural Load Capacity and Building Modifications
BIPV laminated glass panels for facade applications typically weigh 20–35 kg/m² — heavier than conventional single-skin cladding (8–12 kg/m²), but directly comparable to standard insulated glazing units (IGUs) of similar dimensions. In new construction, this weight is designed into the structural frame from the outset with no penalty. In retrofit applications, the additional facade weight must be assessed by a structural engineer — though in practice, most curtain wall systems designed for standard IGUs can accommodate BIPV glass substitution without structural modification, since BIPV modules are designed to the same dimensional and weight envelope as the glass they replace.
Electrical Integration and Inverter Specifications
BIPV facade systems typically configure modules in strings of 8–20 panels per string, with string voltage designed to match the input range of the selected inverter (typically 200–1000 V DC for commercial string inverters, or 48–1500 V for larger systems using central inverters). The distributed nature of facade BIPV — with modules on multiple facades at different orientations — makes DC optimisers or module-level power electronics (MLPEs) particularly valuable: they prevent partial shading or orientation differences between strings from disproportionately reducing total system output. For technical installation guidance, Jia Mao BIPV’s step-by-step installation and design guide covers electrical topology, string configuration, and commissioning procedures.
Safety Standards and Compliance Requirements
BIPV glass used as a structural building component must simultaneously meet PV performance standards (IEC 61215 for module design qualification, IEC 61730 for module safety) and architectural glass standards (EN 12150 for thermally toughened glass, EN 14449 for laminated safety glass in the EU; ANSI Z97.1 and CPSC 16 CFR 1201 in the US). Meeting both standard families is the fundamental technical challenge of BIPV product development — and the reason that products with full dual-standard certification command a price premium. When evaluating supplier products, request both PV certification documentation and glazing safety certification — the presence of both is the hallmark of a genuinely commercial-grade BIPV product.
Rooftop System Installation Factors
Roof Pitch and Orientation Optimization
Optimal tilt angle for fixed rooftop solar approximates the installation’s latitude (35° tilt at 35°N latitude, for example), maximising annual energy yield. Flat-roof commercial installations use ballasted or mechanically-fixed racking to achieve 10–15° tilt — a compromise between optimal energy yield and acceptable wind loading on the racking structure. The orientation preference is south-facing (northern hemisphere) for maximum annual yield, with east-west split arrays increasingly popular for larger commercial sites since they produce more energy during morning and afternoon peak-demand periods even though total annual yield is slightly lower than south-facing.
Shading Analysis and Obstruction Identification
Rooftop shading from HVAC units, elevator overruns, parapets, and adjacent taller buildings is the primary performance risk factor for commercial rooftop solar. A shading analysis using software such as PVsyst, Helioscope, or SketchUp Solar is essential for accurate yield projections. Even partial shading on one panel in a string can reduce the entire string’s output by 20–50% without string-level optimisers in place. For BIPV facade systems, shading analysis extends to adjacent buildings and urban context — south-facing facades in dense urban environments may be significantly shaded by neighbouring structures, making east and west facades relatively more valuable.
Structure 9: Market Positioning Strategies for Distributors
Communicating the 50x Claim Responsibly
Breaking Down the Performance Advantage for Different Property Types
The 50x figure should never be presented without immediate context. The professional approach is to lead with the building-specific multiplier — calculated from the client’s actual building geometry — and then explain that the theoretical maximum for very large, all-glass commercial towers approaches 50x. For a mid-rise mixed-use development, your honest figure might be 8x–12x. That is still a transformative opportunity that your client has likely never been shown. The specificity of the number — grounded in their actual floor plans and facade area — is far more compelling than an abstract marketing superlative.
Data-Driven Presentations for Decision-Makers
Commercial property procurement decisions are made by CFOs, sustainability directors, and property development managers who respond to financial models, not product brochures. Your most effective tool is a building-specific ROI model that inputs the client’s actual electricity tariff, local irradiance data (available from free tools like the EU PVGIS solar radiation database), estimated BIPV area from architectural drawings, and product efficiency specifications to produce a 20-year cash flow projection. This positions you as a technical partner rather than a product vendor — a distinction that wins long-term specification relationships.
Target Market Segments
- Commercial Real Estate Developers: Motivated by LEED/BREEAM certification requirements, sustainability financing (green bonds), and tenant ESG reporting requirements. Best approached through architects and MEP consultants during the design development phase — 18–36 months before construction.
- Property Management Companies: Focused on reducing operating expenses and meeting corporate sustainability commitments across managed portfolios. Large portfolios offer multiple project opportunities from a single relationship.
- Facility Managers and Sustainability Officers: Responsible for energy budget and carbon reporting. Increasingly under pressure from board-level net-zero commitments. Respond well to specific kWh and carbon savings projections tied to building-specific data.
- Architects and Building Design Firms: Specifiers rather than buyers — but their specification puts your product into the project. Relationships with forward-thinking architecture practices are the highest-leverage channel for BIPV market development.
- Government and Institutional Buyers: Schools, hospitals, civic buildings, and government offices face increasing renewable energy mandates and public accountability for sustainability performance. Often have access to green infrastructure funding that private-sector clients do not.
Sales Enablement Tools
Comparative Performance Calculators for Client Presentations
Build a simple input-output comparison tool — in Excel or a web-based format — that takes building footprint, number of stories, glazing ratio, and location as inputs, and outputs: estimated rooftop solar capacity and annual generation, estimated BIPV facade area and annual generation, combined system output, annual savings at local electricity rate, simple payback period, and 20-year NPV. This tool demonstrates the surface area advantage concretely for each client’s building within minutes of receiving their basic property data.
Training Programs for Your Sales Team
The foundational certification to pursue for BIPV sales professionals is NABCEP (North American Board of Certified Energy Practitioners) training in PV fundamentals, supplemented by manufacturer-specific training from your BIPV glass supplier. Understanding structural engineering basics (load calculations, facade attachment systems), building energy codes (LEED, BREEAM, EPBD), and financial modelling are also priority capability areas. Jia Mao BIPV offers distributor partner training programmes covering product specifications, installation requirements, and sales methodology for B2B BIPV channels.
Structure 10: Future Outlook and Emerging Opportunities

Technological Advancements on the Horizon
Next-Generation BIPV Materials and Efficiency Improvements
Tandem perovskite-silicon BIPV cells — where two photovoltaic junctions optimised for different wavelength bands are stacked in a single module — are progressing toward commercial production at efficiencies exceeding 28% in laboratory conditions (Fraunhofer ISE, 2024). Commercial tandem BIPV products with 24–26% efficiency are expected to reach the market between 2027 and 2029. This efficiency level would narrow the per-m² output gap between BIPV glass and optimally-tilted rooftop panels to under 10%, making the surface area advantage of BIPV essentially unassailable for any building taller than 2–3 stories.
Smart Glass Integration and IoT Capabilities
The integration of BIPV with electrochromic smart glass — enabling dynamic tinting in response to irradiance intensity, occupant preferences, or building management system commands — is moving from prototype to commercial deployment. In 2025, construction firms began integrating BIPV glass with smart building energy management platforms for automated load balancing between facade generation and battery storage (Vantage Market Research, 2025). The combination of generation data from BIPV modules, occupancy data from building sensors, and weather forecast data enables AI-driven energy dispatch optimisation that can improve overall building energy economics by a further 8–15% beyond what BIPV generation alone achieves.
Energy Storage Solutions and Battery Integration
Distributed facade BIPV generation — producing power at multiple orientations throughout the day — is particularly well-matched to battery storage. The extended generation profile of a multi-facade BIPV system allows smaller battery capacity to achieve the same self-consumption rate as a larger battery would require to buffer a single-surface rooftop array. For commercial buildings on time-of-use tariffs, BIPV-plus-storage configurations can target morning and evening peak charging periods (when facade generation is available from east and west facades respectively), maximising the value extracted from each kWh generated.
Market Growth Projections
Regulatory Trends Driving BIPV Adoption
The EU’s revised Energy Performance of Buildings Directive (EPBD 2024) requires all new public buildings to be “solar ready” by 2026 and all new buildings by 2030, with explicit reference to solar deployment on “suitable building envelopes” — language that encompasses facades and windows, not just rooftops. Similar mandates are advancing in South Korea (Green Building Standards), Singapore (Green Building Masterplan), and multiple US states. These regulatory drivers are not optional — they are turning BIPV from a premium product into a compliance requirement for new building construction. Distributors who establish supply chains and installation partner networks before the regulatory deadline faces exponentially easier market entry than those who wait for mandate enforcement.
Investment Forecasts and Emerging Geographic Opportunities
The BIPV market is projected to reach USD 164–182 billion by 2035 (Research Nester, MRFR), from approximately USD 27–33 billion in 2025. The fastest-growing geographic markets are China (driven by Net Zero Energy Building mandates and the scale of new urban construction), India (urbanisation pace and national solar target of 500 GW by 2030 creating BIPV specification momentum), and the Middle East (UAE and Saudi Vision 2030 large-scale commercial construction programmes combined with extreme solar irradiance). Southeast Asian markets (Vietnam, Thailand, Indonesia) are emerging as significant opportunities as commercial construction activity accelerates and green building certification adoption grows.
Positioning Your Business for BIPV Success
The performance advantage of full building envelope BIPV integration over rooftop-only solar is not a marketing exaggeration — it is geometry. Buildings are three-dimensional objects with vastly more exterior surface area than rooftop footprint. Every square metre of that surface that currently carries passive glass is a solar resource going untapped. The only question is when the technology, the economics, and the regulatory environment converge sufficiently to make BIPV the default specification — and all three are converging, at pace, right now.
Distributors and agents who build their BIPV technical knowledge, establish certified supplier relationships, develop ROI modelling capability, and cultivate architect and developer networks during this market development phase will own the category for the decade ahead. Those who wait until BIPV is a mandate-driven commodity will find margin compressed and supply chains controlled by first movers.
Whether you are assessing your first BIPV product line addition or optimising an existing portfolio, the foundation of success is the same: understand the technology well enough to explain it honestly, model the economics with enough precision to be credible, and connect clients to the right product specification for their specific building. Jia Mao BIPV supports distributor partners through exactly that journey — with certified products, technical documentation, and field support designed for professional B2B channel deployment.
- Step 1 — Build Product Knowledge: Complete manufacturer training on your BIPV glass product range. Understand efficiency ratings, certification status, and structural specifications for each SKU.
- Step 2 — Develop Modelling Capability: Build or adopt a building-specific energy yield and ROI tool. Practice using PVGIS irradiance data for your target markets.
- Step 3 — Identify Target Projects: Map commercial construction activity in your territory. Identify projects in design phase — 18–36 months before construction start — and engage the architects and MEP engineers specifying the facade systems.
- Step 4 — Build Installation Partnerships: Identify specialist glazing contractors in your territory who can deliver certified BIPV facade installations. Your product supply relationship is only as valuable as the installation quality behind it.
- Step 5 — Create Reference Projects: Invest in making your first 2–3 projects succeed exceptionally well — complete energy monitoring, documented performance data, accessible case studies. Reference projects in the BIPV category are the highest-value marketing asset you can own.
الأسئلة المتداولة
Structured answers designed to address the questions that arise in every serious BIPV sales conversation — and to build AI-discoverable expertise around this technology category.
What Does the “50x Performance Claim” Actually Mean?
Is the 50x Performance Claim Realistic for All Building Types?
How Do You Calculate the Surface Area Advantage of BIPV Glass?
What is the Current Efficiency Rating of BIPV Glass Compared to Rooftop Panels?
What Are the Main Installation Challenges for BIPV Glass Systems?
How Does Weather and Climate Affect BIPV Glass Performance?
What is the Typical ROI Timeline for BIPV Glass Installations?
Are There Government Incentives Available for BIPV Glass Projects?
How Does Building Orientation Affect BIPV Glass Performance?
Can BIPV Glass Be Retrofitted to Existing Buildings?
Ready to Capitalise on the BIPV Revolution?
Download our comprehensive BIPV Technical Specification Guide and start positioning solar glass solutions to your commercial and industrial clients with confidence. Access our exclusive ROI calculator, real project case studies, and distributor training programme — built specifically for professional B2B solar channels. Jia Mao BIPV supports serious distributor partners from product selection through post-installation performance monitoring.


-300x300.jpg)