From Concept to Reality:
A Building Owner’s Roadmap to BIPV Installation
Building-integrated photovoltaics (BIPV) offer a transformative opportunity to generate renewable energy while enhancing your property’s aesthetic and financial value. This comprehensive guide walks through material selection, financial analysis, implementation timelines, and ongoing maintenance — so you can make every decision with clarity and confidence.
Understanding BIPV as a Strategic Asset
A commercial property developer in Copenhagen retrofitted his south-facing office tower façade with BIPV glass panels. Eighteen months later, his electricity bill was down 31%, his building’s BREEAM certification jumped from “Good” to “Excellent,” and two major tenants cited the building’s sustainability credentials in their lease renewal decisions.
Building-Integrated Photovoltaics (BIPV) — solar modules that replace conventional building materials rather than sitting on top of them — represents one of the most significant shifts in how building owners can think about their physical assets. Rather than treating your roof, façade, or glazing purely as a cost (maintenance, replacement, weatherproofing), BIPV transforms those surfaces into energy-generating revenue streams that produce returns for 25–30 years.
Unlike conventional rooftop solar, BIPV is not an addition to your building. It is your building material — meaning the financial comparison must account for both the energy value and the material replacement value simultaneously. When you do that calculation correctly, projects that appear expensive on a cost-per-watt basis often prove to be financially compelling on a total-lifecycle basis.
This guide is written for building owners, developers, asset managers, and contractors who need a complete, practical roadmap — not a marketing brochure. Every section contains real cost ranges, honest timeline expectations, and actionable decision frameworks derived from current market data and real project experience.

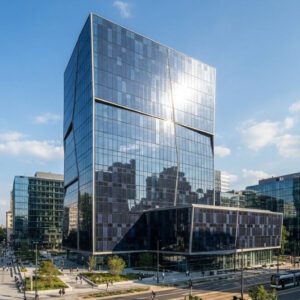
A modern commercial building with integrated solar façade — every square metre of glass generating electricity while providing weather protection and daylighting. This is the BIPV opportunity in physical form.
📖 Key Terms for This Guide
- BIPV — Building-Integrated Photovoltaics
- Solar modules that replace conventional building materials (roof tiles, façade cladding, window glazing). The solar element and the building element are one inseparable product. Remove it, and the building loses its weather barrier.
- BAPV — Building-Applied Photovoltaics
- Conventional solar panels mounted on racking above existing building surfaces. The building and the solar system remain two separate, independent systems.
- kWp — Kilowatt-peak
- The rated power output of a solar system under Standard Test Conditions (STC: 1,000 W/m² irradiance at 25°C). Used to size and compare systems; real-world output will be lower.
- NPV — Net Present Value
- The total value of a project’s future cash flows, discounted back to today’s money. A positive NPV means the investment creates financial value beyond its cost of capital.
- IRR — Internal Rate of Return
- The discount rate at which an investment breaks even on an NPV basis. Higher IRR = better financial performance. Used to compare BIPV against alternative investments.
- PPA — Power Purchase Agreement
- A financing structure where a third party owns and installs the BIPV system and sells you the electricity generated at an agreed rate, eliminating upfront capital cost.
Assessing Your Building’s BIPV Readiness
Before committing budget to a BIPV project, a structured readiness assessment prevents expensive surprises later. The assessment covers three domains: your site’s physical and solar characteristics, your building’s structural and systems capacity, and the climate environment your installation will operate in for the next 25–30 years.
Conducting a Site Assessment
Solar irradiance — the amount of solar energy available at your location — is the single most important determinant of BIPV energy output and financial return. It varies more than most building owners expect: the south of Spain receives approximately 1,800–2,100 kWh/m²/year of global horizontal irradiance (GHI), while the UK receives 900–1,150 kWh/m²/year. A system generating €25,000/year in Madrid may generate €12,000–15,000/year on the same building footprint in Glasgow — the design and ROI calculation must reflect your actual location.
Roof orientation matters significantly for rooftop BIPV tile systems. South-facing roofs at 30–35° pitch receive close to the optimal irradiance in the Northern Hemisphere. East or west-facing roofs receive approximately 70–80% of south-facing yield. North-facing roofs are generally not viable for roof tile BIPV. For façade systems, south-facing elevations capture 60–70% of what an optimally tilted roof receives — but west-facing façades have the advantage of generating peak electricity in the late afternoon, when building cooling demand and grid electricity prices are typically higher.
Structural load capacity is the next critical check. BIPV glass panels for façade applications weigh 20–35 kg/m², compared to 8–12 kg/m² for standard curtain wall glazing. For retrofit projects, a structural engineer must confirm that the existing frame and foundations can carry the additional load — or specify the required reinforcement. For new construction, BIPV loads can be designed in from the start, which is both structurally and commercially the optimal approach. Access the full specification process in the BIPV systems specification guide from Jia Mao BIPV.
Understanding Climate and Weather Considerations
Climate affects not just energy yield but material durability and maintenance requirements. Coastal environments accelerate corrosion of aluminium framing and electrical connectors — specify marine-grade materials and connection systems if your building is within 20 km of the coast. Regions with regular freeze-thaw cycles (Central Europe, Northern USA, Canada) require sealant systems and module fixings designed to accommodate frost expansion. High-dust environments (Middle East, North Africa) reduce annual output by 5–25% without regular cleaning — a cleaning and O&M cost that must be built into the financial model from day one.
Reviewing Existing Building Systems
BIPV generates DC electricity that must be converted to AC by an inverter and then fed into the building’s electrical distribution system. The existing switchgear, metering, and distribution board capacity must be checked against the planned BIPV system output — a 500 kWp façade system may generate peak AC outputs that exceed the capacity of a building’s existing main distribution board, requiring switchgear upgrades that add $15,000–$50,000 to project cost if not identified early. Additionally, if the building is pursuing BIPV integration with HVAC thermal management — using the waste heat from BIPV panels to pre-heat ventilation air (a BIPV/T system) — the HVAC design must accommodate this function from the outset.
Selecting BIPV Materials That Match Your Goals
BIPV is not a single product — it is a family of building-material categories, each with different performance characteristics, cost structures, and optimal applications. Selecting the right product type for your building type and financial objectives is the most consequential decision in the entire project. Making this decision based on aesthetics alone — without understanding the performance and cost trade-offs — is the most common source of project disappointment.
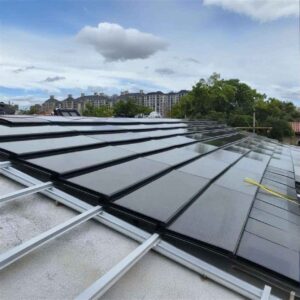
BIPV Tiles and Roofing Solutions
BIPV roof tiles are the product category with the strongest residential and premium commercial market pull, driven partly by the brand visibility of Tesla Solar Roof and partly by genuine architectural demand for rooftop solar that is visually indistinguishable from traditional roofing materials. Modern BIPV tiles from specialist manufacturers — including the Jia Mao BIPV solar roof tile range — achieve 17–23% cell efficiency while meeting Class A fire ratings and wind uplift standards for most jurisdictions.
Monocrystalline silicon tiles offer the highest efficiency (19–23%) and the most reliable long-term performance data. They are available in matte black, dark grey, and charcoal finishes that complement contemporary and traditional architectural styles alike. Polycrystalline silicon tiles offer slightly lower efficiency (15–19%) at a modest cost reduction but are less common in premium architectural applications due to the blue-grey cell appearance. For most premium residential and commercial rooftop applications, monocrystalline is the default specification.
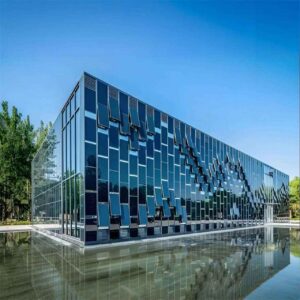
Façade Cladding and Wall-Integrated Systems
BIPV façade systems replace conventional curtain wall glazing, metal cladding, or stone panels with photovoltaic glass modules that generate electricity from the building’s vertical surfaces. This application has the largest addressable surface area on commercial buildings and the strongest dual-function value proposition: the BIPV panel simultaneously provides weatherproofing, thermal insulation, solar shading, and energy generation from the same installed square metre.
Ventilated façade systems — where a 30–150 mm air cavity separates the BIPV panels from the building wall — provide passive cooling for the PV cells, improving electrical output efficiency by 5–12% compared to non-ventilated configurations. They also allow moisture that enters the cavity to drain naturally, reducing waterproofing risk. Non-ventilated systems (direct-fix BIPV cladding panels) are simpler to install and achieve a slimmer profile, but generate more heat and require higher-performance sealant systems to manage moisture risk. For most commercial buildings in temperate or warm climates, ventilated configurations are the preferred specification.
BIPV Windows and Transparent Glazing
Semi-transparent BIPV window modules allow visible light through while harvesting solar energy from UV and near-infrared wavelengths. The energy output trade-off is significant: commercial BIPV glazing with 20–40% Visible Light Transmittance (VLT) — the percentage of visible light that passes through the glass — generates approximately 50–120 Wp/m², compared to 150–400 Wp/m² for opaque façade panels. The trade-off is real, but so is the value: a building with BIPV glazed curtain walls replaces standard double-glazed units with energy-generating panels at a broadly comparable total installed cost, generating electricity from surfaces that conventional solar cannot access.
PV glazing with 30% VLT also reduces direct solar gain, cutting cooling loads in air-conditioned buildings by 15–25% in high-irradiance climates — a building energy benefit that does not appear in the module output specification but appears directly in the quarterly electricity bill. Compare specifications for semi-transparent BIPV products in the glass-integrated solar panel systems review.
Balcony and Canopy Systems
BIPV canopy and balcony systems generate electricity from horizontal or near-horizontal overhead structures — carparks, pedestrian walkways, outdoor hospitality terraces, and building entrance canopies. Because these structures provide shade as their primary function, the BIPV panels must satisfy glass safety standards for overhead glazing (typically laminated safety glass to EN 14449 in Europe, ANSI Z97.1 in the USA) in addition to standard PV certification. Overhead BIPV glass panels must maintain structural integrity in the event of any individual module failure — a requirement that drives specification of larger-area laminated units with robust frame systems, and adds 15–25% to canopy system costs compared to roof-mounted BIPV.
| BIPV Category | Module Efficiency | Typical Cost Range | Payback Period | Best Applications | الضمان |
|---|---|---|---|---|---|
| Roof Tiles (Mono-Si) | 17–23% | $250–$420/m² | 7–12 yrs | Premium residential, heritage | 25-yr power / 10-yr product |
| Opaque Façade Panels | 13–20% | $280–$550/m² | 10–15 yrs | Commercial office, institutional | 25-yr power / 10-yr product |
| Semi-Transparent Windows | 6–15% | $350–$625/m² | 12–20 yrs | Office glazing, atrium, retail | 25-yr power / 10-yr product |
| Canopy / Overhead | 14–20% | $320–$580/m² | 8–14 yrs | Carparks, walkways, terrace | 25-yr power / 10-yr product |
| Conventional BAPV (ref.) | 20–24% | $100–$220/m² | 3–7 yrs | Flat/pitched industrial roofs | 25-yr power / 10-yr product |
Conducting a Comprehensive Cost-Benefit Analysis
Breaking Down Installation Expenses
BIPV project costs span five distinct categories. Understanding each one prevents the budget surprises that have damaged confidence in the technology across multiple markets. According to Jia Mao BIPV’s detailed cost breakdown analysis, BIPV hardware averages $3,000–$5,000 per kWp, compared to $1,000–$2,500 per kWp for conventional BAPV — but that hardware premium funds dual functionality that a conventional solar panel cannot deliver.
Note: Retrofit projects typically carry 15–25% higher labour and engineering costs than new-build BIPV due to existing structure adaptation requirements.
Identifying Available Incentives and Financing Options
Incentive programmes vary significantly by geography and change frequently — always verify current availability with a qualified tax or energy finance advisor before finalising your financial model. As of 2025, the US federal commercial Investment Tax Credit (ITC) under Section 48 has undergone significant policy changes — projects that began construction before applicable sunset dates may still qualify for meaningful credits, but new projects face an evolving landscape. Review the current position with the IRS Form 3468 instructions or qualified tax counsel.
In the European Union, BIPV projects can access multiple funding streams simultaneously: national renewable energy subsidy programmes, EU Cohesion Funds for energy efficiency upgrades, and — for projects achieving green building certification — preferential green finance from development banks. Germany’s KfW Energy Efficient Building programme offers low-interest loans at 1.2–2.8% for qualifying BIPV installations. The EU’s Green Bond framework, where green bonds are issued against BIPV assets, is increasingly used by institutional property investors to reduce financing costs by 30–80 basis points versus conventional debt.
| Financing Structure | Upfront Capital | Who Owns System | Best For | ROI Implication |
|---|---|---|---|---|
| Cash Purchase | Full project cost | Building owner | Well-capitalised owners | Highest lifetime return |
| Commercial Loan | 10–20% deposit | Building owner | Most commercial owners | Strong when rate < IRR |
| Green Bond | Nil (bond issuance) | Building owner | Institutional property investors | Reduces cost of capital |
| PPA (Power Purchase Agreement) | Zero | Third-party developer | Budget-constrained owners | Lower lifetime savings |
| Solar Lease | Zero | Leasing company | SME property owners | Reduced but predictable |
| PACE Financing (USA) | Zero | Building owner | US commercial real estate | Repaid via property tax |
Calculating Long-Term Energy Savings
A BIPV financial model must account for two dynamics that dramatically change the long-term numbers: electricity price inflation and system output degradation. On electricity pricing, commercial rates in Europe and the USA have increased at an average of 3–6% per year over the past decade — a trend driven by grid decarbonisation infrastructure investment that shows no signs of reversing. At 4% annual electricity price inflation, a system saving €20,000/year in Year 1 saves €44,000/year in Year 20 in nominal terms — and the NPV of the total 25-year savings substantially exceeds the upfront project cost in most European commercial markets.
On system degradation: quality BIPV modules from certified manufacturers degrade at 0.5–0.7% per year — meaning a system generating 500,000 kWh in Year 1 generates approximately 88–93% of that in Year 25. Most manufacturer warranties guarantee a minimum of 80% of initial rated output at Year 25, providing contractual protection against accelerated degradation.
Evaluating Non-Financial Benefits
Building owners consistently undervalue the non-energy financial benefits of BIPV — to the point where these benefits alone sometimes justify investment in markets where energy economics are marginal. Three are particularly quantifiable for commercial properties:
Property Value Premium
The IEA PVPS Technical Guidebook (2025) notes that buildings with BIPV systems create the potential for higher property values due to reduced operating costs and enhanced sustainability credentials. Studies in Scandinavian and German markets show 4–9% premium valuations for BIPV-equipped commercial buildings on a like-for-like basis.
Green Building Certification
BIPV systems contribute to multiple credit categories in LEED and BREEAM certifications simultaneously: Energy and Atmosphere (on-site generation), Materials and Resources (dual-function building product), and Innovation credits. Moving from one certification tier to the next can increase lease rates by €5–€25/m²/year in prime markets.
Tenant Retention & Premium
In commercial real estate, sustainability credentials have shifted from “nice to have” to a procurement criterion for major corporate tenants. A 2024 CBRE survey found 67% of corporate tenants in Europe require energy performance certificates above a minimum threshold. BIPV demonstrates commitment to sustainability with a physical, permanent asset — not just a certificate.
ESG Reporting & Carbon Credits
BIPV generates Renewable Energy Certificates (RECs) in most markets, which can be sold or applied against corporate carbon reporting obligations. For assets held by institutional investors with net-zero portfolio commitments, BIPV provides directly measurable decarbonisation that supports ESG disclosure requirements under TCFD, GRI, and SFDR frameworks.
Projecting ROI Timelines and Financial Outcomes
Establishing Your Payback Period
The simple payback period — total installed cost divided by annual energy savings — is the starting point for most building owner conversations, but it significantly understates total financial return for long-life assets like BIPV. Use it as a quick filter: if simple payback exceeds 20 years under conservative assumptions, the project likely does not have a compelling financial case. If it is below 15 years, proceed to full NPV and IRR analysis.
| السيناريو | BIPV Type | حجم النظام | Installed Cost | Annual Savings | Simple Payback | 25-yr NPV (5%) |
|---|---|---|---|---|---|---|
| Best Case New build, high irradiance, ITC incentive |
Roof tile + Façade | 250 kWp | $900K | $145K | 6.2 yrs | $1.28M |
| Realistic Case Commercial retrofit, mid-latitude |
Façade + Canopy | 180 kWp | $810K | $88K | 9.2 yrs | $540K |
| Conservative Case Semi-transparent windows, N. Europe |
BIPV Glazing | 90 kWp | $620K | $38K | 16.3 yrs | $68K |
| Industrial Canopy Warehouse, South EU, EV charging |
Solar Canopy | 400 kWp | $1.4M | $195K | 7.2 yrs | $1.85M |
NPV and IRR Modelling Over 25–30 Years
NPV (Net Present Value) and IRR (Internal Rate of Return) are the financially rigorous tools that transform a simple payback estimate into a robust investment case that your board, bank, or investment committee will accept. The key inputs are: installed cost (including all soft costs, not just hardware), annual energy generation (using PVGIS or PVWatts modelling for your specific location), electricity price today and escalation assumption (conservative: 2–3%; realistic: 3–5%), system degradation rate (use 0.5%/year for quality BIPV), discount rate (typically 5–7% for commercial real estate), and any applicable incentives (government grants, tax credits, REC revenue).
- Energy Cost Savings — 52%
- Material Substitution Value — 22%
- Property Value Uplift — 14%
- Certification / ESG Benefits — 8%
- REC / Carbon Credits — 4%
Energy savings dominate the financial case, but the 22% material substitution value is the unique BIPV differentiator — it does not exist in conventional solar and is the primary reason the cost-per-watt comparison is misleading.
Navigating Regulatory, Permitting, and Compliance Requirements
▶ Watch: Building-Integrated Photovoltaics explained — covering principles, architectural applications, and installation standards. Essential context for building owner conversations with permitting authorities.
Building Codes and Safety Standards
BIPV installations operate under two simultaneous regulatory frameworks: the PV electrical standards (IEC 61215 design qualification; IEC 61730 safety qualification) and the building product standards applicable to the envelope component being replaced. A BIPV curtain wall panel must comply with EN 13830 (curtain wall performance) as well as IEC 61215 — a dual compliance burden that adds certification cost and complexity but is non-negotiable for responsible installation.
In the USA, the primary building code reference for BIPV roof panels is IBC Section 1507.17, which specifies minimum roof slope requirements (2:12 minimum), fire classification standards, and underlayment requirements. The National Electrical Code NEC Article 690 governs the PV electrical system — including rapid shutdown requirements, arc fault protection, and grounding/bonding specifications. Both apply simultaneously, and meeting one does not satisfy the other. The UL BIPV certification programme provides a consolidated testing pathway that satisfies both frameworks for products certified through their process.
Electrical Codes and Grid Connection Standards
Connecting a BIPV system to the utility grid requires a formal interconnection application — a process that varies significantly by utility and jurisdiction. In the USA, systems above 10 kW typically require a full interconnection study that can take 3–18 months. In the EU, net metering rules and grid connection timelines vary by member state. Germany’s Marktstammdatenregister requires registration of all new PV systems. The UK’s Distribution Network Operator (DNO) approval process for commercial installations typically takes 6–12 weeks but can extend to 26 weeks for larger systems requiring grid reinforcement.
Plan utility interconnection in parallel with permitting — not after it. Starting the interconnection application only after building permits are secured is the most common source of unexpected 3–6 month delays in BIPV project timelines.
Streamlining the Permitting Process
✅ Electrical single-line diagram and equipment list
✅ BIPV module IEC 61215/61730 certification documentation
✅ Fire classification test reports (per local building code)
✅ Architectural drawings showing BIPV integration
✅ Weathertightness test reports (façade systems)
✅ Utility interconnection application and agreement
✅ Installation contractor licence and insurance certificates
✅ Energy modelling report (for net-zero or LEED compliance)
Document preparation & submission: 2–4 weeks
Building permit review: 2–8 weeks
Electrical permit review: 1–4 weeks
Heritage/planning authority (if applicable): 4–16 weeks
Utility interconnection application: 6–26 weeks
Total (typical commercial project): 8–20 weeks
Note: All timelines run concurrently if applications are submitted in parallel. Sequential submission can double total duration.
Selecting Qualified Installers and Partners
The BIPV installation partner you select has more impact on project outcome than almost any other decision you make. BIPV installation sits at the intersection of PV electrical contracting and building envelope installation — a dual competency that is genuinely rare in the current market. Selecting a contractor who is skilled in one domain but not the other is the most common cause of BIPV installation quality issues.
Vetting Installers and System Integrators
Request evidence of both PV installation certification (NABCEP in the USA; MCS or equivalent in the UK; relevant national certification in other markets) AND building envelope installation credentials (glazing contractor accreditation, curtain wall installation experience, roofing contractor licensing as applicable). Ask for references from at least three completed BIPV projects — not conventional solar installations — of comparable scale to your project. Call those references. Specifically ask about post-installation performance against the energy model, and about any weathertightness issues in the first 12–24 months.
The step-by-step BIPV installation guide from Jia Mao BIPV provides a detailed methodology framework that can also serve as a contractor capability assessment tool — compare a prospective installer’s proposed methodology against the guide to identify gaps in their process.
Establishing Clear Contracts and Expectations
BIPV contracts must address two dimensions that standard solar installation contracts typically do not. First, performance guarantees: require a contractual energy generation guarantee (kWh/year) for the first 5–10 years, with defined remediation obligations if actual generation falls below the guarantee threshold. This forces the installer to own the quality of their energy modelling and installation workmanship simultaneously. Second, warranty responsibility matrix: explicitly define in the contract which party (module manufacturer, installer, structural engineer, architect) is responsible for each category of potential failure — module electrical defects, weathertightness failures, structural fixing failures, and sealant degradation. Ambiguity in this matrix is the primary driver of warranty disputes.

Selecting the right BIPV installation partner requires verifying dual competency in both PV electrical systems and building envelope installation — a rare combination that demands careful pre-qualification.
Implementing Your BIPV Installation Project
Installation Phases and Milestones
A well-managed BIPV installation follows a defined phase sequence where each phase produces a documented output before the next begins. Skipping phase verification steps — particularly structural inspection and electrical testing — is the primary cause of costly rework and project delays in BIPV projects.
Site Preparation
Scaffold or access equipment erection, temporary weatherproofing, delivery logistics planning, crew induction and safety briefing. Duration: 3–7 days.
Structural Preparation
Sub-frame anchor installation, structural fixing torque verification, anchor load testing. Engineer sign-off required before proceeding. Duration: 5–14 days.
Module Installation
BIPV module placement, mechanical fixing, inter-module joint sealing, visual inspection at each row. Duration: proportional to area — typically 1–2 days per 100 m².
Electrical Works
DC string wiring, junction box installation, conduit routing to inverters, inverter installation and commissioning. Licensed electrician required throughout. Duration: 5–15 days.
Quality Control
Thermal imaging survey across installed modules (detects hot spots, wiring faults), weathertightness water test, electrical insulation resistance test, string performance check.
Commissioning
Grid connection activation, monitoring system configuration, generation baseline establishment, performance dashboard setup, client handover documentation.
Quality Control and Performance Verification
Two quality control tests are non-negotiable before system handover: a thermal imaging inspection (thermographic scan of all installed modules under generation conditions, identifying hot spots, delamination, and wiring faults invisible to visual inspection) and an electrical insulation resistance test (confirming the DC wiring system has no earth faults before utility connection). Both tests should be conducted by an independent third-party inspector, not by the installing contractor. The cost is typically $0.50–$2.00/m² of installed area — a modest investment relative to the system value and the cost of rectifying undetected faults post-handover.
Maintenance Requirements and Long-Term Performance Management
Preventive Maintenance Schedules
BIPV systems require less maintenance than most building systems — but they are not maintenance-free, and skipping routine maintenance consistently delivers the single most common outcome: discovering a problem in Year 8 that has been developing since Year 2, with consequential energy loss for the intervening years. Annual maintenance cost for a well-managed commercial BIPV system typically runs $200–$500 per year for a small residential-scale system, scaling to 0.5–1.5% of installed capital cost per year for large commercial installations. Budget this from day one.
| Task | Frequency | Who Performs | Indicative Cost | What It Detects |
|---|---|---|---|---|
| Module surface cleaning | 1–4× per year | Trained cleaning team | $0.30–$1.20/m²/visit | Soiling, output reduction |
| Visual inspection | Semi-annually | Maintenance technician | $150–$400/visit | Physical damage, sealant condition |
| Electrical connection check | Annually | Licensed electrician | $300–$800/visit | Connector corrosion, torque loss |
| Thermal imaging survey | Every 2–3 years | Certified thermographer | $0.80–$2.50/m² | Hot spots, delamination, wiring faults |
| Inverter service | Annually | Inverter-certified technician | $200–$600/inverter | Fan wear, capacitor degradation |
| Sealant / weathertightness inspection | Every 3–5 years | Façade engineer | $500–$2,000/visit | Sealant degradation, water ingress |
| Full performance audit | Every 5 years | Independent PV engineer | $1,500–$5,000 | Systematic degradation vs. model |
Performance Degradation Over Time
Quality BIPV modules from certified tier-1 manufacturers degrade at approximately 0.5–0.7% per year, broadly consistent with conventional silicon PV panels. This means a system generating 500,000 kWh in Year 1 generates approximately 450,000–465,000 kWh in Year 20, and 425,000–440,000 kWh in Year 25. Most manufacturer warranties guarantee a minimum of 80% of initial rated output at Year 25 — meaning if your Year 25 output falls below 80% of nameplate, you have a warranty claim regardless of the specific degradation pathway.
The degradation mechanisms most specific to BIPV (versus conventional BAPV) are encapsulant yellowing from combined UV and thermal stress in poorly ventilated installations, and moisture ingress causing delamination at module edges. Both are preventable through proper initial design (adequate ventilation, correct sealant specification) and detectable through regular thermal imaging — which is why thermal surveys appear in the maintenance schedule above with higher frequency than in conventional solar O&M programmes.
Maximising Value Through Operational Excellence
Energy Management and Consumption Optimisation
A BIPV system that generates electricity is only as financially valuable as the electricity it displaces or exports. Self-consumption — using the generated electricity within the building rather than exporting it to the grid — is financially superior in most markets where export tariffs are lower than import rates. Maximising self-consumption means aligning high-consumption activities with peak generation periods: scheduling HVAC pre-cooling in the morning before occupancy, timing EV charging for midday solar peaks, and pre-heating domestic hot water during peak generation hours.
For buildings where generation peaks don’t align naturally with consumption patterns, battery energy storage bridges the gap. A BIPV system paired with a battery bank can achieve 70–90% self-consumption ratios even in commercial buildings with predominantly occupancy-hours consumption profiles — improving financial return by capturing the full difference between the higher import tariff and the lower export tariff. The IEA-PVPS 2025 report on PV-powered EV charging documents how combining BIPV canopy systems with EV charging infrastructure creates a premium commercial asset that generates revenue from both energy and parking, with payback periods 20–35% shorter than standalone BIPV.
Monitoring, Analytics, and Data-Driven Decisions
Modern BIPV systems generate performance data every 5–15 minutes across every inverter and — in well-specified systems — every module. This data is only valuable if it is reviewed, acted upon, and compared against the design model. A BIPV system that performs at 85% of modelled output generates a 15% annual financial shortfall — on a $1M investment, that may represent $8,000–$12,000/year in unrealised savings that accumulates silently if nobody is watching the dashboard.
Configure your monitoring system with: (1) a daily generation alert if output falls more than 10% below weather-adjusted expectations; (2) a string-level alert for any string showing more than 15% below its peers; and (3) an annual automated comparison of actual vs. modelled cumulative generation with a variance analysis report. Cloud-based platforms from leading inverter manufacturers (SMA Sunny Portal, SolarEdge mySolarEdge, Fronius Solar.web) provide these capabilities as standard.
Planning for Future Technology Integration
A BIPV system designed today will be operating in 2050. Planning for technology integration that doesn’t yet exist requires building in flexibility rather than locking in specific technologies. Practically, this means: installing DC cable conduits with 20–30% spare capacity for future additional modules or string re-configurations; providing structural anchor points and cable routes for future battery system installation even if batteries are not in the initial scope; and ensuring your inverter selection supports smart grid interfaces (dynamic export limitation, frequency response, demand response) that utility companies will increasingly require from commercial PV systems over the next decade.

Real-time BIPV performance monitoring platforms allow building owners to track generation, identify underperformance, and benchmark against the design model — turning raw energy data into actionable financial intelligence.
Case Studies and Real-World Implementation Examples
The following projects represent different building types, market contexts, and implementation approaches — each illustrating a specific aspect of the BIPV implementation roadmap in practice.

🏢 Commercial Real Estate
Commercial Office — BIPV Façade Integration
A 12-storey commercial office tower in Munich replaced its ageing curtain wall during a planned renovation, specifying BIPV glass panels on the south and west elevations covering 1,800 m². Total BIPV system: 220 kWp. Annual generation: approximately 165,000 kWh — enough to cover 38% of the building’s base electrical load. The building’s energy efficiency rating moved from class C to class A+. Two major corporate tenants cited the upgrade in their lease renewal negotiations, with one extending their lease by 5 years and the other taking an additional floor.
Financial outcome: Total installed cost €1.15M (net of façade material substitution credit). Annual energy savings: €38,000 at €0.23/kWh. Simple payback: 10.1 years. BREEAM recertification moved from “Good” to “Excellent.”

🏘️ Residential Development
Residential Multi-Family — BIPV Roof Integration
A 48-unit residential development in the Netherlands specified BIPV monocrystalline roof tiles across all south-facing roof planes during new construction. Because the BIPV tiles replaced conventional premium clay tiles, the net incremental cost of the solar generation function was reduced by 32% compared to a standalone BIPV-addition approach. Each unit generates approximately 3,200 kWh/year — covering approximately 85% of individual apartment electricity needs. Post-occupation occupant satisfaction surveys showed 91% reporting the roof’s appearance as “better than conventional solar panels” and 84% rating it as “the same or better than traditional tiled roofs.”
Financial outcome: Developer absorbed full BIPV cost; achieved 7.8% premium on sale prices versus comparable non-BIPV units in the same market.

🏭 Industrial / Logistics
Industrial Facility — BIPV Canopy + EV Charging
A 45,000 m² logistics hub in southern France installed BIPV canopy structures over 600 HGV and employee parking spaces, generating 800 kWp of installed capacity. The canopy infrastructure was required regardless of the solar element (covered parking was a contractual tenant requirement), meaning the incremental solar cost was approximately €580,000 against a total canopy cost of €2.1M. 80 EV charging points were integrated beneath the canopy, generating €120,000/year in charging revenue in Year 1. Combined energy savings and EV charging revenue: €285,000/year. Payback on the incremental solar cost: 2.0 years.
Financial outcome: One of the strongest BIPV business cases documented — driven by the genuine zero-cost material substitution (the canopy was required) and the dual revenue stream.

🏙️ Mixed-Use Development
Mixed-Use Development — Integrated BIPV Strategy
A 22,000 m² mixed-use development in Singapore (retail ground floor, offices above, residential upper floors) implemented a phased BIPV strategy across three building surfaces: BIPV opaque glass façade panels on office floors (south elevation), semi-transparent BIPV skylights over the retail atrium (28% VLT), and BIPV canopy over the arrival plaza. Total generation: 410 kWp. The phased implementation — façade first, skylight second, canopy third — allowed early performance data from Phase 1 to validate energy modelling assumptions before committing Phase 2 and 3 capital. This adaptive management approach reduced overall project financial risk and improved stakeholder confidence.
Taking Action on Your BIPV Investment
Key Takeaways for Building Owners and Decision-Makers
BIPV is a building infrastructure decision, not a solar technology decision. The most effective framing is: “What building envelope surfaces am I planning to build or renew in the next 5 years, and which of those surfaces have solar potential that BIPV could harvest?” That question focuses the decision on where BIPV genuinely competes with conventional materials on a total-cost basis, rather than where it competes with conventional solar on a cost-per-watt basis — a comparison it is structurally unlikely to win.
The financial case varies significantly by application. BIPV canopies replacing infrastructure that was required regardless deliver the strongest ROI — sometimes below 3 years. BIPV roof tiles on south-facing new-build residential deliver payback periods of 7–12 years with strong aesthetic and property value benefits. BIPV façades on commercial buildings deliver payback periods of 8–15 years, often justified as much by LEED/BREEAM certification uplift and tenant retention as by direct energy savings. Semi-transparent BIPV windows make financial sense in high-irradiance markets and buildings with significant cooling loads, where the combined energy and shading benefits narrow the payback period.
Your Implementation Timeline — Next Steps
Frequently Asked Questions About BIPV Installation
Ready to Transform Your Building Into a Renewable Energy Asset?
Connect with the Jia Mao BIPV specialist team for a personalised BIPV readiness consultation — from initial feasibility through product specification and ongoing performance support.


-300x300.jpg)