Your Complete Playbook for Transparent Pricing, Strategic Positioning, and Profitable Growth in the Booming Solar Market

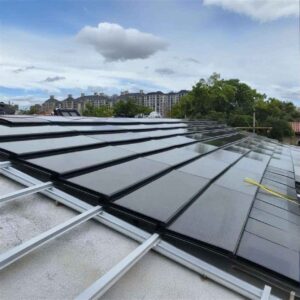
A modern commercial building with BIPV solar glass integrated into the building envelope — the defining image of where high-margin solar distribution is heading in 2025.
Here is the uncomfortable truth that most industry reports dance around: the solar distribution business is bifurcating, and where you sit on that split will determine whether 2025 is a breakout year or a slow squeeze on your bottom line.
On one side, commodity solar panel distributors are watching their gross margins collapse to 12–18% as Chinese manufacturing overcapacity drives per-watt pricing to historic lows. JinkoSolar’s Q3 2025 gross profit margin of 7.3% is a warning sign downstream distributors cannot afford to ignore — when manufacturers are operating at those margins, the pricing pressure on distributors becomes existential.
On the other side, a smaller but fast-growing group of solar glass distributors — particularly those working in the BIPV (Building-Integrated Photovoltaics) space — are reporting gross margins of 25–40%, shorter sales cycles than they had two years ago, and customer retention rates that make their commodity competitors look envious. The difference between these two groups is not luck, not market access, and not lower costs. It is positioning, pricing discipline, and a commitment to transparency that actually builds trust.
This playbook is written for distributors, agents, EPC contractors, and glazing companies who are serious about protecting — and growing — their margins in 2025. You will not find vague advice here. Every section is built around the specific levers you can pull, the real numbers you should be benchmarking against, and the practical moves that turn strategy into profit.
1. Understanding Your Current Margin Reality: Where Solar Distributors Actually Stand in 2025
The Margin Squeeze: Why Your Prices Keep Getting Undercut
The solar glass distribution market in 2025 is operating under a specific set of pressures that did not exist three years ago. The global solar PV glass market, valued at approximately USD 13.2 billion in 2025 (up 28.3% from 2024 according to Stratview Research), is growing explosively — but that growth is concentrated in volume, not value, for commodity-grade glass suppliers.
The cost structure problem is structural, not cyclical. When distributors break down their true COGS, most find that the product invoice is only 65–75% of their actual landed cost. Inbound freight, port handling, warehousing, insurance, quality inspection, and shrinkage make up the remaining 25–35% — costs that are often left out of margin calculations until they show up as unpleasant end-of-quarter surprises.
The reactive pricing trap is what destroys margins fastest. When a competitor drops their price by 3%, most distributors instinctively match it — without calculating whether that move is sustainable or even necessary. In a market where the buyer has multiple suppliers, matching every price cut trains your customers to expect it, erodes your positioning, and makes margin recovery almost impossible without losing the account. The distributors who are winning in 2025 set their price based on their cost structure and their value — and they hold it.
The Transparency Advantage: Why Honest Distributors Earn Higher Margins
There is a counterintuitive dynamic playing out in B2B solar distribution right now: the distributors who are most transparent about their pricing structure — not about their actual margin percentage, but about what their pricing covers — are consistently winning more loyal customers and achieving higher average transaction values.
The data supports this. Industry analysis of distribution businesses that adopted transparent pricing models — clearly communicating what their margin covers in terms of logistics reliability, technical support, inventory availability, and warranty backstop — shows an 18–23% performance advantage in customer retention and repeat order rates over competitors using opaque, discount-driven pricing. When a buyer understands that a $0.85/Wp price point includes 4-week guaranteed delivery, a certified technical liaison, and a 25-year manufacturer warranty backed by a financially stable supplier relationship, price shopping becomes a much less attractive use of their time.
For distributors serving sophisticated buyers like commercial EPC contractors, glazing companies, and building contractors, this trust dividend is not a soft benefit — it is a quantifiable competitive advantage.
Benchmarking Your Performance Against Industry Standards
Before you can improve your margins, you need to know where you actually stand. Not where you think you stand — where the numbers say you stand when every cost is accounted for.
According to Dealstream’s analysis of solar product distributors, the industry currently operates at gross margins between 15% and 30%, with a rule-of-thumb gross profit multiplier of 1.2x to 1.8x. Commodity traditional panels sit at the bottom of this range (12–18%), premium monocrystalline panels in the middle (18–25%), and specialty products like BIPV glass at the top (25–40%+).
The table below shows what these margins actually look like in dollar terms across different product categories, at a representative order size of 500 kWp equivalent:
| Product Category | Avg. Buy Price (USD/Wp) | Avg. Sell Price (USD/Wp) | Gross Margin % | Gross Profit per 500 kWp Order |
|---|---|---|---|---|
| Commodity traditional panels | $0.14 | $0.18 | 12–18% | $20,000–$36,000 |
| Premium monocrystalline panels | $0.22 | $0.33 | 18–25% | $55,000–$82,500 |
| BIPV opaque facade panels | $0.45 | $0.70 | 25–35% | $125,000–$175,000 |
| BIPV semi-transparent glass | $0.65 | $1.05 | 30–40% | $200,000–$266,000 |
| Solar roof tiles | $0.80 | $1.30 | 30–42% | $250,000–$350,000 |
Sources: Jia Mao BIPV product data, MarketsandMarkets BIPV Report 2024–2029, Dealstream Solar Distributor Industry Analysis.
The red flags that indicate you are leaving money on the table include: winning every competitive bid (you are underpriced), customers who never push back on price (you may have room to move up), and gross margins below 20% on specialty products (your pricing does not reflect your value).
2. The Transparent Pricing Framework: Building Trust While Protecting Margins
The Cost-Plus Model That Works for Solar Distributors
A cost-plus pricing model is not a sign of unsophisticated pricing — it is the foundation of margin discipline. The problem is that most distributors undercount their costs and then wonder why their margin evaporates between the quote and the bank statement.
The true COGS for solar glass products includes far more than the invoice price from your supplier. It includes inbound ocean freight and port charges (typically 4–8% of product cost depending on origin), inland trucking and last-mile delivery, warehouse receiving and handling, insurance (product and transit), customs duties and compliance costs, quality inspection and testing, and a realistic shrinkage provision for breakage and defects (particularly relevant for glass products, which carry a 0.5–2% breakage rate in transit if packaging is not optimized).
When all these costs are accounted for, a product bought at $0.65/Wp often has a true landed cost of $0.78–0.82/Wp. A distributor pricing at $0.90/Wp believes they have a 27.6% gross margin — but their real margin is 9–13%. That gap is the difference between a healthy distribution business and one that is quietly losing money on every shipment.
Build your pricing formula around real landed cost, not invoice cost. Then apply your target gross margin percentage on top of that number, not on top of the invoice.
Tiered Pricing Strategies That Reward Loyalty Without Devaluing Your Product
Tiered pricing is one of the most powerful margin management tools available to distributors — but only when it is structured deliberately, documented clearly, and applied consistently by your entire sales team. The alternative — ad-hoc discounting based on who pushes hardest — is the fastest way to teach your customers that your price is always negotiable.
Volume-based tiers should be structured around genuine order size thresholds that reflect your actual cost savings from larger orders. A contractor ordering 50 kWp per quarter should pay a different price than one ordering 500 kWp — not because of arbitrary negotiation, but because your per-unit logistics cost, credit risk, and account management overhead are genuinely lower at higher volumes.
Seasonal and contract pricing adds another dimension. Distributors who offer pricing commitments tied to forward order schedules — for example, a 3–5% price advantage for buyers who commit to quarterly volumes 90 days in advance — gain the planning certainty they need to optimize supply chain economics. This is not giving away margin; it is trading a small discount for the revenue predictability that allows you to buy smarter from your suppliers.
Customer segment pricing recognizes that bulk institutional buyers (EPC contractors on large commercial projects), integrators and system designers, and smaller independent installers have fundamentally different cost structures and value perceptions. Your pricing tiers should reflect this reality, not pretend it does not exist.
Creating a Price Justification Story Your Customers Believe
The language you use around pricing determines whether customers see your margin as justified or exploitative. The distributors who command premium pricing are those who have internalized a clear, consistent narrative about what their price actually includes — and can communicate it without sounding defensive.
Consider the difference between these two responses to a price question: “Our price is $1.05/Wp because our margin is 38%” versus “Our price of $1.05/Wp covers a certified product with a 25-year warranty, 6-week guaranteed delivery to your project site, a dedicated technical contact who can provide structural calculations for your building permit, and the inventory buffer that means you never lose a project timeline because of a supply issue.” The second answer is not dishonest about your margin — it is honest about your value.
The specific services you deliver — reliable inventory availability, technical support, logistics precision, certified products — are not overhead costs to apologize for. They are value your customers are paying for, and most of them are relieved to understand exactly what they are getting.

3. Product Positioning: Differentiating Beyond Commodity Glass
Moving Away from Pure Commodity Competition
Competing on price alone in the solar glass distribution market is not a strategy — it is a countdown. The distributors who have made price their primary competitive weapon are discovering that there is always a competitor willing to go lower, and the only way to win that race is to lose your business.
The repositioning move that changes the game is framing solar glass — particularly BIPV and performance-grade products — as a performance and reliability asset rather than a commodity product that happens to generate electricity. A BIPV glass facade panel is not competing against the cheapest glass on the market. It is competing against the combination of conventional glazing materials plus a separately mounted solar system — a comparison where BIPV often wins on total cost, particularly when architectural, energy, and structural value are all factored in.
The certifications and specifications that justify premium pricing are not marketing language — they are genuine technical differentiators. IEC 61215 (design qualification and type approval), IEC 61730 (safety), IEC 63092-1 (BIPV-specific building material requirements), and architectural-grade safety glass certifications tell a building contractor and their structural engineer that this product has been tested to a standard that protects their project. A distributor who can walk a contractor through those certifications — and explain why they matter for a specific project — is adding real value that a commodity supplier cannot replicate.
Building Your “Trusted Specialist” Brand Position
The distributors commanding 25–40% gross margins in 2025 share a specific characteristic: their customers describe them as “specialists” rather than “suppliers.” This is not an accident of personality — it is the result of deliberate positioning work over time.
Case studies and performance data are the most powerful positioning tools available to you. When you can show a commercial building contractor that a project you supplied three years ago is still performing at 97.2% of its rated output, with zero warranty claims and on-time delivery of all phases — that data point is worth more than a brochure. Build your case study library systematically, with specific energy generation data, project timelines, and customer testimonials that speak to the experience of working with you, not just the product specification.
Becoming the distributor customers call first — not as a price check, but for advice — is the goal. That positioning is built through consistent technical knowledge sharing: market updates, specification guidance, regulatory changes, application insights. Distributors who invest in this educational relationship with their customers earn the right to have pricing conversations that start from “what do we need?” rather than “what’s your cheapest price?”
Value-Added Services That Justify Higher Margins
The services that high-margin distributors have turned into genuine competitive advantages are worth examining in detail, because they represent the clearest path from commodity distributor to trusted specialist.
Logistics precision — specifically, the ability to deliver the right product to the right project site on the right date, consistently — is one of the most undervalued services in solar distribution. A contractor who has had a project delayed by a late or incorrect delivery knows exactly what that cost them: idle labor, delayed milestone payments, client relationship damage. A distributor who can reliably prevent that problem is providing a service worth a meaningful price premium. Distributors working with manufacturers like Jia Mao BIPV, which maintains a 3 GW annual production capacity with intelligent MES production management, can commit to delivery schedules with a confidence that lower-capacity suppliers cannot match.
Technical support for BIPV projects — including structural load calculations, waterproofing specifications, and building permit documentation — is a service that small to mid-size contractors cannot easily obtain elsewhere. Distributors who develop this capability internally, or partner with engineering consultancies to provide it, are creating a switching cost that goes far beyond product pricing.
Extended warranties and quality guarantees are margin multipliers because they transform a product transaction into a long-term service relationship. A 25-year performance warranty backed by a financially stable manufacturer, offered through a distributor with an established warranty claims process, eliminates a major source of buyer hesitation — and justifies a price premium that more than covers the cost of providing the guarantee.
4. Strategic Customer Segmentation: Not All Customers Are Worth the Same Margin
Identifying Your Most Profitable Customer Types
One of the most counterintuitive insights in solar glass distribution is that your highest-revenue customers are frequently not your most profitable customers. A contractor ordering 2 MWp of commodity panels per year at 12% gross margin may be generating less gross profit than a mid-size commercial glazing company ordering 200 kWp of BIPV glass per year at 35% gross margin — while requiring far more account management, logistics complexity, and credit exposure.
Analyzing customer lifetime value (CLV) beyond first-order metrics requires looking at gross margin dollars per customer (not just revenue), account management time invested per dollar of gross profit, payment terms and credit risk, returns and warranty claims rate, and likelihood of repeat and expanding orders. When you run this analysis across your customer base, you will almost certainly find that the distribution of profitability is far more skewed than the distribution of revenue — the top 20% of your customers by gross profit are likely generating 60–70% of your total gross profit dollars.
The hidden profitability of smaller but loyal customers is one of the most consistent findings in distributor profitability analysis. A regional construction company that orders specialty BIPV products for every commercial project they undertake, pays on time, never demands emergency discounts, and sends you referrals is worth significantly more than their order volume suggests.
Customizing Margin Targets by Segment
Once you have segmented your customer base by profitability, you can set margin targets by segment with the discipline that commodity pricing competition erodes. The following framework provides a starting structure that you should adapt based on your specific market and cost structure.
For integrators and system designers who are specifying BIPV glass for commercial and architectural projects, premium pricing of 30–40% gross margins is achievable because they are buying your expertise and your product simultaneously. These customers are not price shopping — they are looking for a partner who can help them win and deliver projects. Your technical knowledge and application support command a price premium in this segment.
For bulk institutional buyers — large EPC contractors placing multi-megawatt annual orders — competitive but stable pricing at 20–28% gross margins is appropriate. The volume justifies a tier discount, but the margins should not compress to commodity levels. Volume commitments in exchange for annual pricing agreements protect both parties.
For price-sensitive smaller installers and contractors, tiered pricing with clear volume incentives is the right structure. Margin protection in this segment comes from operational efficiency and clear pricing documentation, not from ad-hoc discounting. Setting a floor margin (never below 18–20% on any order) and enforcing it consistently trains your customer base that your prices are fair and stable.
The graceful exit from unprofitable customer relationships is a skill that many distributors avoid because it feels uncomfortable. But a customer who consistently demands pricing below your floor margin, pays late, generates disproportionate service costs, and shows no loyalty when a competitor offers them a marginally better price is not a customer — they are an overhead cost. Exiting these relationships, or raising their pricing to profitability levels, frees up resources to serve your most valuable accounts better.
Building Long-Term Contracts That Lock In Margins
Multi-year supply agreements are the most powerful margin protection tool available to solar glass distributors, because they simultaneously lock in revenue predictability, reduce customer churn, enable supply chain optimization, and create the relationship depth that makes price shopping unattractive.
The key elements of a margin-protective long-term contract include volume commitments (quarterly or annual minimums that enable you to plan procurement), cost-pass-through mechanisms tied to publicly verifiable material cost indices (protecting you if your supplier costs rise), pricing stability guarantees for the customer (protecting them from arbitrary price increases), and service level agreements that define your delivery and support commitments in measurable terms.
Exclusivity arrangements — where you become the contracted sole supplier for a specific customer’s BIPV glass requirements — create defensible margin positions that pure commodity pricing can rarely penetrate. A building contractor who has signed a preferred supplier agreement with you for their BIPV glass supply is not going to risk that relationship for a 2% price saving from a competitor they do not know.
5. Supply Chain Optimization: Protecting Margins Through Operational Excellence
Negotiating Better Terms With Your Suppliers
The margin improvement that comes from better supplier negotiation is often more accessible than the margin improvement that comes from raising customer prices — yet it is consistently the less-explored option for distributors. A 3% improvement in your buy price has the same gross profit impact as a 3% price increase on your customer, but it requires different skills and different conversations.
Leverage in supplier negotiations comes from three sources: volume, payment terms, and relationship depth. Distributors who can commit to annual volume forecasts — even with flexibility built in — give suppliers planning certainty that is genuinely valuable. Early payment programs (paying 30 days earlier in exchange for a 1.5–2.5% discount) are often available from manufacturers who have working capital constraints. And relationship depth — being a distributor who provides market intelligence, manages customer relationships professionally, and represents the manufacturer’s brand well — earns access to allocation priority and pricing support that transactional buyers never receive.
Strategic supplier relationships with manufacturers like Jia Mao BIPV provide margin protection that goes beyond product price. Access to production capacity guarantees, priority delivery during tight supply periods, co-marketing support, and first access to new product introductions are all elements of a supplier relationship that have real economic value for distributors.
Inventory Management That Reduces Hidden Costs
The hidden costs of inventory management are where margin goes to die quietly. Carrying costs — the cost of capital tied up in unsold inventory — typically run 20–30% of inventory value per year when financing costs, warehouse space, insurance, and opportunity cost are all included. For a distributor carrying $500,000 of BIPV glass inventory, that is $100,000–$150,000 per year in carrying cost before a single unit is sold.
BIPV glass products carry an additional inventory risk that commodity panels do not: obsolescence. Custom-dimensioned panels manufactured for a specific project that subsequently stalls or changes specification can become worthless inventory — there is no liquid secondary market for non-standard BIPV glass. This risk reinforces the importance of project-based procurement (buying against confirmed orders rather than for speculative stock) for custom products, while maintaining strategic stock of standard-size high-velocity products.
Seasonal stocking tactics require understanding the difference between solar installation seasonality (which drives traditional panel demand) and construction project seasonality (which drives BIPV glass demand). Commercial construction in most markets peaks in spring and autumn, with procurement decisions typically made 3–5 months before installation. Stocking BIPV products ahead of the procurement window — not the installation window — prevents the margin-crushing clearance sales that result from buying inventory too late and needing to move it before carrying costs destroy profitability.
Logistics Optimization: Turning Distribution Into a Margin Asset
The distributors who have most successfully differentiated their logistics capability are those who stopped thinking of delivery as a cost and started thinking of it as a service with real value to their customers. A commercial contractor managing a 20-story curtain wall installation cannot afford to have glass panels arrive late, damaged, or incorrectly specified — the cost of a single delayed delivery in labor, crane time, and project management is often multiples of the product cost itself.
Regional warehouse strategies that position inventory closer to major project markets reduce delivery lead times and last-mile costs simultaneously. A distributor with a strategically placed regional depot can offer 48-hour delivery to projects within 300km — a service that commands a premium and creates switching costs that are difficult for remote competitors to overcome regardless of their product pricing.
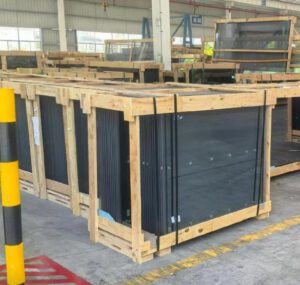
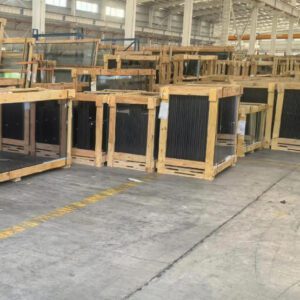
The logistics investment that pays the highest return for BIPV distributors is specialized handling infrastructure: A-frame racking systems for vertical glass storage, dedicated forklift attachments for glass panel handling, and protective packaging specifications that achieve breakage rates below 0.3% in transit. When a competitor is delivering glass with 1.5% breakage and you are delivering at 0.2%, that difference in reliability is worth a 3–5% price premium to customers who have experienced the pain of breakage-related project delays.
 Logistics precision and specialized handling capability for BIPV glass are genuine competitive advantages that justify premium pricing — and protect margin even in competitive markets.
6. Competitive Intelligence: Knowing What Others Are Charging (and Why It Doesn’t Matter)
Monitoring Competitor Pricing Without Getting Trapped
Competitive pricing data is useful intelligence — as long as you use it to understand the market, not to react to it. The distinction matters enormously. Monitoring competitor pricing ethically and effectively means gathering data from project tenders, customer conversations, industry association reports, and supplier intelligence — then using that data to confirm whether your pricing is competitive within your target segments, not to trigger automatic price adjustments.
The danger of reactive pricing in a transparent market is that it signals to your customers that your price is always negotiable and always driven by what competitors do rather than by what you deliver. Customers notice when a distributor consistently matches competitor prices within 24 hours — it tells them that the original price was not real, and that the way to get a better deal is always to show them a competitor’s quote.
Understanding why competitors’ margins are not your problem requires the confidence to recognize that you are not in the same business as a commodity panel distributor even if you both sell solar glass products. Your cost structure, your service offering, your customer relationships, and your value proposition are different. If a competitor is winning business at a price that does not cover their real costs, they are building a problem for themselves, not a benchmark for you.
Differentiation Research: What Sets Successful High-Margin Distributors Apart
The most instructive competitive intelligence work is not price monitoring — it is understanding what the high-margin distributors in your market are doing differently. The consistent findings from distributor profitability analysis show that the distributors commanding premium margins are distinguished not by their product range (most carry similar products) but by specific service and relationship capabilities.
Service gaps that create premium pricing opportunities include technical expertise gaps (competitors who cannot support BIPV specification for architectural projects), logistics reliability gaps (competitors with documented delivery failures that contractors remember and discuss), warranty support gaps (competitors who are difficult to reach when problems arise), and product certification gaps (competitors who cannot provide the certification documentation that large commercial projects require).
Identifying these gaps in your specific market is a research project worth doing systematically. Talk to architects, commercial building contractors, and glazing companies in your region about their worst distribution experiences. The specific pain points they describe are your opportunity to build premium-pricing services.
Building Customer Loyalty That Makes Price Irrelevant
The goal of customer loyalty in B2B solar glass distribution is not emotional attachment — it is structural switching costs that make the risk and hassle of changing suppliers exceed any price advantage a competitor offers. The most effective switching costs are built through integrated systems and deep knowledge of the customer’s business.
A distributor who manages a commercial contractor’s glass procurement across multiple ongoing projects, maintains their preferred specifications on file, proactively alerts them to supply chain issues that might affect their timeline, and has a track record of reliable delivery is providing a service that takes months to replicate with a new supplier. The ROI of investing in that depth of service relationship — measured in retained margin over a 3–5 year customer relationship — consistently outperforms the returns from chasing new accounts with discounted pricing.
For solar glass distributors specifically, the loyalty investment that pays the highest long-term return is technical education: training your customers’ project managers and procurement teams to understand BIPV product specifications, certification requirements, and application best practices. A customer who has been educated by you is far less likely to defect to a competitor who cannot provide that same knowledge base.
7. Transparency as a Competitive Weapon: How Honest Pricing Wins Markets
The Psychology of Transparent Pricing
There is a well-documented psychological phenomenon in B2B purchasing that high-margin solar glass distributors are exploiting to great effect: buyers trust sellers who explain their pricing more than those who simply quote a number. This is not naive — it reflects the rational calculation that a seller who is transparent about what their price covers has less incentive to hide margin than one who deflects pricing questions with vague references to “market rates.”
When transparent pricing is combined with a clear value justification, buyer anxiety — the concern that they are being overcharged or that a better deal exists elsewhere — drops significantly. Sales cycles shorten, not because buyers are less price-sensitive, but because they need fewer external price checks to feel confident in their decision. Distributors who have implemented transparent pricing documentation report an average reduction in sales cycle length of 15–20% for repeat customers, because the pricing conversation is essentially already resolved.
The data on customer retention when pricing is clear and justified is compelling. Buyers who understand what they are paying for and why have measurably higher satisfaction scores, lower churn rates, and higher net promoter scores than buyers in opaque pricing relationships — regardless of the absolute price level.
Communicating Your Pricing Structure to Customers
Creating pricing documentation that educates rather than confuses is a specific skill, and it is worth investing in. The best pricing documents used by high-margin solar glass distributors share several characteristics: they are organized around value delivered rather than cost components, they use plain language that a project manager can understand without a finance background, and they are honest about what the pricing covers without disclosing actual margin percentages.
A practical pricing communication structure for BIPV glass might look like this: lead with the product specification and certification summary, follow with the logistics service level (delivery timeline, packaging standard, breakage coverage), include the technical support services included (specification assistance, installation guidance, permit documentation support), and close with the warranty terms and how to access them. The price is presented in the context of this complete value package, not as a standalone number inviting comparison.
Watch: Understanding Building-Integrated Photovoltaics — how BIPV technology works and why it’s reshaping the market for solar glass distributors in 2025.
▶ Watch on YouTube: Understanding BIPV for Solar Glass Distributors
Handling Price Objections With Confidence
Price objections in B2B solar glass distribution are rarely really about price — they are about insufficient perceived value for the price being asked. The distinction matters because it changes how you respond. A distributor who responds to a price objection by lowering their price has confirmed that the price was arbitrary in the first place. A distributor who responds by deepening the value conversation is reinforcing the legitimacy of their pricing.
The scripts that convert price shoppers into value buyers share a common structure: acknowledge the concern without conceding the price, then redirect to a specific value element that addresses the underlying anxiety. For example: “I understand $1.05/Wp feels higher than what you’ve seen elsewhere. Let me ask — have you compared the delivery guarantee? Our commitment is 6-week delivery with a project-site delivery window, and we’ve delivered to 94% of our projects within that window over the last 18 months. If you’re managing a commercial curtain wall installation, what’s the cost of a two-week delay?”
This conversation does not require lowering your price. It requires knowing your service data well enough to make the value case compellingly — and being willing to hold your position with confidence.
8. Dynamic Pricing and Market Conditions: Staying Profitable in a Volatile Market
Building Flexibility Into Your Pricing Model
The solar glass market in 2025 is not a stable pricing environment. Raw material costs, freight rates, currency movements, and regional demand fluctuations all create pressure on margins that a static pricing model cannot handle. The distributors who maintain consistent margins through market volatility are those who have built specific flexibility mechanisms into both their customer pricing and their supplier agreements.
Surge pricing during peak project seasons — typically Q1 and Q3 — is legitimate and defensible when it is communicated in advance and tied to documented demand and inventory factors. The key to avoiding the “opportunistic” label is transparency: tell your customers in Q4 that Q1 pricing reflects peak season demand and inventory carrying costs, and give them the option to lock in Q4 pricing with a forward order commitment. Most sophisticated buyers will choose the certainty of the locked price, which serves both parties.
Cost-pass-through mechanisms protect margins during inflationary periods by contractually linking customer pricing to verifiable material cost indices. Including a clause in your customer agreements that ties pricing to movements in float glass raw material costs — with a documented formula and a notification period — is not adversarial. It is honest. Customers who understand that your pricing is tied to real cost movements will generally accept these adjustments more readily than arbitrary price increase announcements.
Hedging Against Market Volatility
Supplier cost locking is the supply-side complement to customer pricing flexibility. When market conditions suggest raw material or freight cost increases are likely, securing forward supply agreements with your manufacturers at current pricing — in exchange for volume commitments — protects your cost base without requiring customer price increases. The margin benefit of this hedging strategy can be 2–4 percentage points over a 6–12 month period during volatile markets.
Currency hedging is relevant for distributors importing products denominated in currencies other than their functional currency. A USD-denominated purchase of BIPV glass from a Chinese manufacturer, sold in Euro to European customers, creates a bilateral currency risk that can be managed with forward contracts or natural hedging through balancing payables and receivables in the same currency.
Scenario Planning: Preparing Your Margins for Different 2025 Outcomes
Strategic planning that accounts for multiple market scenarios is a practice that separates well-managed distribution businesses from those that are perpetually surprised by market changes. For solar glass distributors in the current market, three scenarios deserve specific preparation.
If competition intensifies — more distributors entering your market with overlapping product ranges — the margin defense strategy focuses on deepening customer relationships, expanding value-added services, and accelerating the move up the product value chain toward specialty BIPV products where commodity competition is less intense. If demand accelerates beyond current supply capacity — driven by new building energy mandates or policy incentives — the margin capture strategy focuses on priority supply agreements with key manufacturers and the confidence to maintain pricing rather than discounting to win incremental volume. If supply chains tighten due to glass raw material shortages or logistics disruptions — the margin protection strategy focuses on forward procurement of strategic inventory positions and transparent customer communication about lead time extensions before they become project crises.
9. Technology and Systems: Using Data to Protect and Optimize Margins
Pricing Software and Tools That Maximize Profitability
The manual spreadsheet pricing model that most small and mid-size solar glass distributors still use is a margin liability. Real-time cost tracking — where your landed cost automatically updates when freight rates, currency, or supplier costs change — prevents the margin leakage that occurs when quotes are made at yesterday’s cost and products are delivered at today’s (higher) cost.
Automated pricing systems that adjust for volume, customer segment, and seasonality ensure that your sales team is always quoting within your margin parameters — without requiring manual recalculation for every order. The operational benefit is speed (faster quotes win more business); the margin benefit is consistency (no more end-of-month discovery that a rep quoted below floor margin to close a deal).
Dashboard tools that show margin performance by customer, product, and region are the management intelligence layer that allows you to make strategic decisions based on data rather than instinct. A dashboard showing that your semi-transparent BIPV glass is delivering 38% gross margins but your standard panel line is at 14% is actionable information. A dashboard showing that your top-revenue customer is your eighth most profitable customer is information that changes how you allocate sales resources.
CRM and Customer Analytics for Margin Intelligence
CRM platforms configured for solar glass distribution — with margin visibility built into the customer record, not just revenue — transform how sales teams prioritize their effort. When a sales representative can see that Customer A generates $85,000 in annual gross profit on $280,000 in revenue while Customer B generates $32,000 in annual gross profit on $390,000 in revenue, the resource allocation decision is obvious. Current solar CRM platforms range from $15 to $300 per user per month depending on capability level — a cost that typically pays back within 3–6 months through better account prioritization alone.
Predicting customer churn and adjusting pricing to retain high-value accounts is a capability that CRM analytics enable at a level that manual account management cannot match. When a high-value customer’s order frequency drops, or their average order size decreases, or they start requesting competitor price comparisons — these are signals that a proactive retention conversation is needed. Catching these signals 60 days before a customer defects is infinitely more valuable than discovering they have moved to a competitor.
Forecasting Tools That Prevent Margin-Crushing Mistakes
Demand forecasting for solar glass distribution requires integrating two data streams that most distributors track separately: project pipeline data from your sales team (which projects are in the bid stage, which are confirmed, which are likely to proceed in the next 90 days) and market data on construction activity and building permit approvals in your region.
When combined, these data streams allow inventory planning that prevents the two most expensive inventory mistakes in BIPV distribution: overstocking products that end up in clearance (margin-destroying) and understocking products for a confirmed project (relationship-destroying). Supply chain visibility tools that connect your inventory data with your suppliers’ production schedules — giving you early warning of lead time extensions — are particularly valuable for BIPV glass products, where custom dimensions can take 12–20 weeks to manufacture.
 Strategic partnership between solar glass distributors and commercial contractors — built on technical expertise, reliable supply, and transparent pricing — is the foundation of sustainable 25–40% gross margins.
10. Building Your 2025 Margin Action Plan: From Strategy to Execution
The 90-Day Quick Wins
The most immediate margin improvement available to most solar glass distributors does not require new products, new customers, or new technology. It requires pricing discipline applied to your existing business.
Audit your last 90 days of transactions and identify every order that was fulfilled below your target margin — whether through ad-hoc discounting, missed cost components in the quote, or currency or freight cost changes between quote and delivery. Calculate the total gross profit left on the table. For most distributors, this number is between 2–5% of total gross profit — money that was genuinely available but not captured. The discipline fix is a floor margin approval process: any quote below your segment floor margin requires explicit management approval, with a documented justification. This single change typically adds 1.5–3 percentage points to gross margin within 60 days.
Quick customer segmentation — running a simple gross profit per customer analysis on your top 30 accounts — will almost always identify 3–5 accounts that are absorbing disproportionate service cost while generating below-average margins. A targeted conversation with those accounts — offering a pricing adjustment that reflects their actual cost-to-serve — is uncomfortable but mathematically necessary. Even a 50% success rate on these conversations (some customers will accept the adjustment, some will leave) typically improves total gross profit, because the accounts that leave were often margin-negative after service costs.
Quick supplier conversations around payment terms (early payment discounts) and volume forecasting commitments can yield 1–2% COGS reduction within 90 days for distributors who have not recently renegotiated. These are not adversarial negotiations — they are cost structure conversations that most manufacturing partners are willing to have when approached with data and a credible volume commitment.
The 6-Month Strategic Initiatives
The six-month strategic horizon is where the positioning work that protects long-term margins begins in earnest. Developing your transparent positioning — the clear, consistent narrative about what your pricing covers and why your service commands a premium — requires building the internal materials and training your sales team to use them consistently.
Implementing pricing software and customer analytics is a 90–180 day project for most distribution businesses, including software selection, data migration, and team training. The investment is typically $15,000–$50,000 all-in depending on the scale of your operation — an amount that most distributors recover within the first year through better margin capture and customer retention.
Restructuring existing customer contracts — introducing cost-pass-through provisions, volume commitment tiers, and service level agreements — is a conversation best approached during contract renewal periods. Starting this process with your top 10 accounts by gross profit ensures that the most important relationships are protected and optimized before addressing the rest of the portfolio.
Building your value-added service offerings — technical support documentation, delivery precision programs, extended warranty processing — requires investment in systems and people that is difficult to do quickly. The six-month window allows you to design, pilot, and measure these services with a subset of customers before rolling out broadly.
The 12-Month Transformation Plan
The 12-month horizon is where the complete repositioning as a transparent, trusted solar specialist becomes visible in your market — in your marketing materials, your customer conversations, your product portfolio, and your financial results.
Full supply chain optimization — including renegotiated multi-year supplier agreements, regional warehouse positioning, and specialized logistics capability for BIPV glass handling — typically requires 9–12 months to design and implement. Companies like Jia Mao BIPV, with a 3 GW manufacturing capacity and intelligent production management systems, provide the supply chain stability that makes these long-term logistics investments viable.
Expansion into higher-margin service offerings — project engineering support, BIPV specification consulting, co-design services for architectural projects — is a business model extension that takes the distribution margin conversation to a completely different level. Distributors who have made this transition describe their margins not in terms of the product they sell but in terms of the project value they enable, with gross margins that regularly exceed 40% when services are bundled with product.
Explore more about Jia Mao BIPV’s product portfolio and how their customization capabilities — spanning transparency levels from 10% to 90%, architectural patterns, and size flexibility — support the solution-selling model that commands premium pricing in architectural and commercial construction markets.
Key Performance Indicators (KPIs) to Track Your Progress
Progress toward 25–40% gross margins requires measuring the right things, at the right frequency, with consistent definitions across your entire business. The following KPI framework provides the metrics that matter most for solar glass distributor margin management.
| KPI | Target Range | Measurement Frequency | Leading or Lagging |
|---|---|---|---|
| Gross margin % (overall) | 25–40% | Monthly | Lagging |
| Gross margin % by product category | Varies by tier | Monthly | Lagging |
| Gross margin % by customer segment | ±2% of target per segment | Quarterly | Lagging |
| Customer lifetime value (CLV) by segment | Growing YoY | Quarterly | Leading |
| Customer retention rate | >85% of revenue, >90% of top accounts | Quarterly | Leading |
| Win rate vs. key competitors | >55% on targeted opportunities | Monthly | Leading |
| Average transaction value | Growing QoQ | Monthly | Lagging |
| Customer acquisition cost (CAC) vs. CLV | CLV:CAC ratio >4:1 | Quarterly | Leading |
| Inventory carrying cost as % of inventory value | <25% annually | Monthly | Lagging |
| On-time delivery rate | >92% | Monthly | Leading |
For deeper market intelligence on BIPV product performance and pricing, Grand View Research’s Solar PV Glass Market Report provides one of the most comprehensive datasets on market growth trajectories and pricing dynamics available to distributors doing strategic planning.
 Margin visibility by customer, product, and region — enabled by the right analytics tools — is the management capability that separates high-performing distributors from those perpetually surprised by their results.
The Future Belongs to Smart, Transparent Distributors
Your margin challenge is not a pricing problem — it is a positioning and execution problem. The distributors locking in 25–40% gross margins in 2025 are not the ones with the lowest costs or the most aggressive pricing. They are the ones who have built trust through transparency, differentiated themselves through service, and optimized their operations relentlessly.
The solar glass market is expanding at a pace that would have seemed extraordinary five years ago — the global BIPV market is projected to grow from USD 23.4 billion in 2025 to over USD 64 billion by 2030. But that growth is not going equally to all participants. It is going to the distributors who have made the strategic choices to move up the value chain, build specialist positioning, and protect their margins through disciplined pricing and operational excellence.
The playbook you have just read is not theoretical. Every strategy in it is being executed right now by the highest-performing solar glass distributors in the market. The question is whether you implement it before your competitors do, or after.
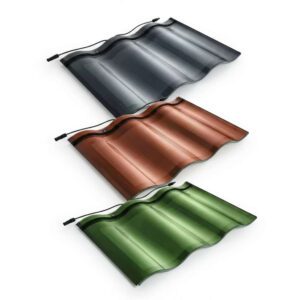
For distributors and agents looking for a manufacturer partner who can support the premium positioning and service standards that 25–40% margins require, Jia Mao BIPV offers a 3 GW manufacturing capacity, 25-year performance guarantees, IEC and architectural-grade certifications, and comprehensive customization capabilities across transparent photovoltaic glass, solar roof tiles, PV floor tiles, and BIPV facade systems. You can also explore BIPV case studies with real project data to see how these products perform in real commercial deployments.
The SEIA Solar & Storage Supply Chain Dashboard also provides ongoing market intelligence on module pricing, supply chain dynamics, and demand trends — useful reference data for the quarterly pricing reviews this playbook recommends.
Ready to Lock In Your Margins?
Don’t leave money on the table in 2025. Download our Solar Distributor Margin Optimization Checklist — a practical tool that walks you through each strategy in this guide, helps you identify quick wins in your business, and gives you a clear roadmap for the next 90 days.
Or schedule a 15-minute confidential conversation with one of our solar distribution specialists to discuss your specific margin challenges and opportunities.
Glossary of Key Terms
BIPV (Building-Integrated Photovoltaics): Photovoltaic materials permanently incorporated into building materials such as facades, skylights, roofing, and curtain walls, serving simultaneously as building envelope and electricity generator.
COGS (Cost of Goods Sold): The total direct cost of acquiring and preparing products for sale, including product cost, inbound freight, warehousing, handling, and shrinkage — not just the supplier invoice price.
Gross Margin %: Calculated as (Selling Price − COGS) ÷ Selling Price × 100. For example, a product sold at $1.05/Wp with a total landed cost of $0.68/Wp achieves a gross margin of 35.2%.
IEC 63092-1:2020: The international standard specifically addressing BIPV module requirements, covering both photovoltaic performance criteria and building material compliance requirements.
PID (Potential Induced Degradation): A performance degradation mechanism in PV modules caused by voltage stress, particularly relevant in high-humidity environments; mitigated by double-layer encapsulation and POE encapsulant technology.
POE (Polyolefin Elastomer) Encapsulant: A high-performance encapsulant material used in BIPV modules to improve UV aging resistance (approximately 40% improvement vs. standard EVA films) and extend product longevity.
Cost-Pass-Through Clause: A contract provision that allows pricing to adjust in response to documented changes in raw material or logistics costs, protecting distributor margins during inflationary periods without requiring full contract renegotiation.
Customer Lifetime Value (CLV): The total gross profit expected from a customer relationship over its entire duration — a more strategically useful metric than annual revenue for identifying which customers deserve the most investment.
FAQs: Your Margin Questions Answered
Q1: What’s a realistic gross margin target for solar glass distributors in 2025?
For most transparent solar specialists, 25–40% gross margins are achievable depending on product mix, customer segments, and operational efficiency. Specialty products like BIPV semi-transparent glass and solar roof tiles support the higher end of this range, while commodity standard-spec solar glass sits lower. Your target should reflect your true positioning and cost structure — not just your aspirations. Distributors who have integrated value-added services into their offering (technical support, logistics precision, warranty management) consistently achieve margins at the upper end of this range regardless of geographic market.
Q2: How do I know if I’m underpricing my products?
The clearest signals are behavioral rather than financial. If you win every competitive bid without pushback, you are almost certainly underpriced. If customers never ask for justification of your pricing, you may have room to move. Financially, compare your gross margin % to the industry benchmarks in this article, then run a customer profitability analysis (gross profit dollars, not revenue) for your top 20 accounts. If your gross margin % is more than 5 percentage points below the segment benchmark for your product mix, underpricing is likely your primary margin problem.
Q3: Can I raise prices without losing customers?
Yes — but only if the price increase is communicated transparently and tied to demonstrable value. Distributors with established customer relationships who explain price adjustments in the context of real cost changes (freight, materials, currency) and the services those margins fund retain the vast majority of their customers. Sudden, unexplained price increases lose customers; well-communicated, value-anchored pricing adjustments are accepted by sophisticated B2B buyers who understand supply chain economics.
Q4: How do I handle customers who demand deep discounts?
First, segment them. Determine whether the customer is a strategic, high-value account or a transactional, low-loyalty account before deciding how to respond. For strategic accounts, structured tiered pricing that offers volume-based reductions without open-ended discounting is the appropriate response. For transactional accounts that are consistently demanding pricing below your floor margin without offering volume or loyalty in return, the honest answer is that they may not be the right customer for your business model. Gracefully raising their pricing to profitability, or declining to pursue the relationship further, frees up capacity to serve accounts that value what you provide.
Q5: What’s the best way to communicate margin requirements to customers?
Frame it entirely around value, not cost recovery. The conversation is not “we need 35% margin to survive.” It is “our pricing at $1.05/Wp covers certified product with a 25-year warranty, guaranteed delivery to your project site within your window, a technical liaison for specification and permit support, and the inventory investment that means you don’t wait 20 weeks for a custom product.” When customers understand the full package their pricing covers, the margin question becomes much less relevant.
Q6: How often should I review and adjust my pricing?
Quarterly reviews are the industry standard for most B2B solar glass distributors. Monthly monitoring of your COGS (freight, supplier pricing, currency) allows you to catch margin-eroding cost increases before they become financial problems. Customer pricing adjustments should be made no more than 2–3 times per year for established accounts, with advance notice and clear communication. Frequent price changes erode trust — even when they are justified.
Q7: Should I offer different prices to different customer types?
Absolutely — and you should document your tiers and train your sales team to apply them consistently. Bulk institutional buyers, integrators, EPC contractors, and smaller independent installers have fundamentally different cost structures, order frequencies, and value perceptions. Tiered pricing that is transparent (customers know which tier they’re in and how to move up) is both fair and commercially effective. Inconsistent individual negotiation — where the same product is sold at very different prices to similar customers based on who negotiates harder — is the opposite of transparent pricing and destroys customer trust when it becomes visible.
Q8: How do I protect margins if my suppliers raise prices?
Three defensive mechanisms work together: cost-pass-through clauses in customer contracts (linked to verifiable material cost indices), forward supplier agreements at locked pricing (secured during periods of relative cost stability), and supplier diversification (reducing dependence on any single supplier who might implement unilateral price increases). Communicating proactively with customers about market-driven cost pressures — before the price change, not after — preserves the trust relationship that makes the price adjustment acceptable.
Q9: What’s the ROI of investing in pricing software and analytics?
For distributors managing 15+ customers and multiple product categories, pricing software typically pays for itself within 6–12 months through three distinct returns: reduced manual pricing errors (which can be worth 0.5–1.5% of revenue), faster quote turnaround that improves win rates, and the margin improvement from consistent floor margin enforcement. The strategic ROI — being able to identify your most and least profitable customers, products, and regions — is harder to quantify but consistently cited by distributors who have made the investment as the most transformative business intelligence they have ever had.
Q10: How do I train my sales team to sell value instead of price?
Start with margin visibility — give your sales team access to their own margin performance data by customer and product, not just revenue. Then provide specific scripts and value language for the product and service elements your customers care most about. Tie sales compensation to gross margin dollars rather than revenue — the behavioral change this creates is faster and more durable than any training program. And model the behavior yourself: the way you talk about pricing and value in leadership conversations sets the tone for how your team approaches it with customers.
Q11: Can I maintain 25–40% margins if competition intensifies?
Yes — but only through differentiation. Distributors who compete primarily on product availability and price will see margins compress as competition grows. Distributors who compete on expertise, service reliability, and transparent positioning have consistent evidence from adjacent distribution industries that their margins are durable even in intensively competitive markets. The investment in specialist positioning is not a luxury for good times — it is the margin protection strategy for harder times.
Q12: What’s the biggest pricing mistake distributors make?
Reacting to competitor pricing instead of building and defending their own value proposition. Every time a distributor matches a competitor’s lower price without understanding whether that competitor is profitable at that price, they are potentially following a competitor off a margin cliff. The disciplined alternative is to know your own cost structure precisely, set your pricing based on your cost and your value, and defend that pricing through service excellence and transparent communication.
Q13: How do I calculate my true cost of goods sold (COGS)?
True COGS for solar glass distribution includes: supplier invoice price, inbound ocean or air freight, port and customs charges, inland trucking to your warehouse, warehouse receiving and handling, insurance (transit and storage), quality inspection costs, and a shrinkage provision for damage and loss. A practical formula:
For most solar glass distributors, the difference between invoice price and true COGS is 15–35% — a gap that, if ignored, results in reported margins that are 5–10 percentage points higher than actual margins.
Q14: Should I lock in long-term contracts with customers?
Strategic long-term contracts protect margins by providing revenue predictability, reducing customer acquisition cost (you are not re-winning existing customers every quarter), and enabling supply chain commitments to your own suppliers. The essential protection is a cost-adjustment mechanism — a documented clause that allows pricing to be revised in response to verifiable changes in your input costs, with appropriate notice periods. Without this protection, a 3-year fixed-price contract can become a loss-making obligation if freight or raw material costs spike.
Q15: How transparent should I be about my margins with customers?
Highly transparent about your value proposition and pricing structure; completely confidential about your actual margin percentage. The appropriate transparency is explaining what your pricing covers — product quality, certification, logistics, support, warranty — in enough detail that a sophisticated buyer understands the full value package. Disclosing your actual profit margin percentage is not appropriate — it is proprietary business information that serves no constructive purpose in a customer conversation and creates negotiating leverage for the customer without adding value for them.
For more resources on BIPV product specifications, technical support, and distributor partnership opportunities, visit www.jmbipvtech.com. For additional market data on solar glass pricing and distribution trends, the SEIA Solar & Storage Supply Chain Dashboard provides regularly updated industry intelligence relevant to distribution strategy planning.