
How global consolidation is reshaping sourcing strategies, extending lead times, and forcing distributors to rethink competitive positioning in the solar energy market
 China’s solar glass manufacturing footprint is not a market share statistic to acknowledge and move past — it is the single most consequential structural reality shaping every sourcing decision, pricing conversation, and delivery commitment you make.
There is a conversation that keeps surfacing in every serious solar glass distribution business right now. It does not start with growth projections or expansion plans. It starts with a much simpler and more urgent question: how do we protect what we have built, in a market that no longer operates the way it did when we built it?
If you distribute solar glass — whether as standard photovoltaic cover glass, BIPV (Building-Integrated Photovoltaics) facade panels, semi-transparent architectural glass, or specialty solar glazing for commercial construction — the supply chain that underpinned your business model three years ago has undergone changes that are not temporary, not cyclical, and not going to self-correct while you wait.
Lead times that once ran 30 days now routinely stretch to 90 days or beyond. China’s elimination of the 9% VAT export rebate on solar products effective April 2026 added a structural cost increase to every unit you import — with zero single-supplier workaround available because every Chinese manufacturer was affected simultaneously. The two dominant Chinese solar glass producers, Xinyi Solar and Flat Glass Group, now collectively control approximately 50% of global solar glass production capacity (FactMR, 2025). And the largest manufacturers are, with increasing frequency, testing direct-to-customer commercial programs in markets where distributors previously held exclusive operational relationships.
This is the new reality. This guide is written to help you navigate it — with specific strategies, real numbers, and a clear-eyed view of which adaptation moves generate genuine competitive advantage and which are expensive distractions.
1. Understanding China’s Manufacturing Stranglehold on Solar Glass
The Scale Advantage You Cannot Ignore
Why 80%+ of Global Solar Glass Production Is Concentrated in Asia
The concentration of solar glass manufacturing capacity in China is not a market share figure that policy or competition will quickly reverse. It is the accumulated result of a decade of capital investment, vertical integration, and scale economics that no competing geography has matched.
China’s share of all manufacturing stages in the solar supply chain — polysilicon, ingots, wafers, cells, modules, and the specialty glass that encases them — exceeds 80%, more than double the combined share of all other manufacturing nations (IEA, Solar PV Global Supply Chains). In photovoltaic glass specifically, China’s 2024 production reached 27.34 million tonnes (Li et al., ScienceDirect, 2025), making it the overwhelmingly dominant supplier for every market on earth that imports solar glass.
Xinyi Solar and Flat Glass Group — the two largest Chinese producers — now operate 12 factories collectively, with the two companies’ combined market share growing from 20.64% to 31.44% of global production between 2019 and 2024. That is not market leadership. That is structural dominance of a kind that rewrites the negotiating dynamics between buyers and sellers in every country that depends on their output.
The global Solar PV Glass market is valued at USD 34.79 billion in 2025 and projected to reach USD 450.64 billion by 2034 (Market Research Future, 2025). The growth is real. But the manufacturing geography of that growth is, for now, firmly anchored in China — and understanding that anchor is the starting point for every sourcing decision you make.
What This Means for Your Negotiation Power
When your primary sourcing geography controls 80% of global supply, your ability to credibly threaten to switch suppliers is severely limited. You can move from one Chinese manufacturer to another — but you cannot escape the pricing dynamics that affect all Chinese producers simultaneously.
The April 2026 elimination of China’s 9% VAT export rebate on solar products is the clearest recent demonstration of this structural vulnerability. Every Chinese solar glass manufacturer had their effective export cost increase by the same amount, at the same time. There was no supplier within China you could switch to for protection. The cost hit every distributor importing Chinese solar glass simultaneously — regardless of which specific Chinese manufacturer they used.
This is the sourcing risk that consolidation creates: not that any single supplier becomes unreliable, but that the entire supply ecosystem responds to the same policy signals in the same direction at the same time, with no internal hedge available.
The Speed-to-Market Problem
From 30 Days to 90+ Days: The New Procurement Reality
The physical geography of a China-to-market supply chain adds transit time that domestic or regional manufacturing does not. Ocean freight from Chinese manufacturing centers (Shandong, Guangdong, and Anhui provinces for solar glass) to Western European ports runs 25–35 days under normal conditions. To North American West Coast ports: 18–22 days. To Australia: 18–25 days. These are transit times before production scheduling, manufacturing, customs clearance, and inland delivery are added.
Under pre-2022 conditions — when manufacturers had more available capacity and order queues were shorter — a competent distributor could manage a 45–55 day total procurement cycle. Under current conditions, with large manufacturers managing order books at high utilization and port congestion creating customs delays, the realistic total procurement cycle for standard solar glass is 75–95 days, and BIPV specialty products requiring custom specifications routinely run 12–20 weeks from order to delivery.
That is not a disruption. It is the new baseline.
Why Your Old Lead Time Estimates Are Costing You Customer Relationships
The distributors losing customer relationships right now are not losing them primarily on price. They are losing them because they quoted lead times based on pre-consolidation assumptions and then revised them upward after the customer had already embedded the shorter timeline into a construction project schedule.
In commercial construction — the primary market for BIPV glass — a critical-path delivery failure is not an inconvenience. A contractor managing a curtain wall installation on a 20-story commercial building typically faces labor costs of USD 15,000–25,000 per day for idle crews, crane rental costs that continue regardless of material availability, and potential liquidated damages clauses in their own contract. A distributor who quotes 45 days and delivers at 90 days has not saved the relationship by eventually delivering. They have made themselves a business risk their customer cannot afford to carry.
Quality Control in a Consolidated Market
The Hidden Risks of Single-Source Dependency
Concentrating sourcing in a single supplier — even a large, certified, established manufacturer — creates a quality risk that many distributors underestimate. The risk is not that a major manufacturer will suddenly produce poor-quality glass. The risk is that quality management rigor is sensitive to the financial pressure the manufacturer is operating under.
Chinese solar manufacturers collectively posted losses of USD 1.54 billion in the first half of 2025 (industry reporting, 2025), driven by overcapacity and module price compression. When manufacturers operate at those margins, cost pressures cascade through their production operations — including decisions about inspection frequency, raw material specification tolerances, and the depth of quality management investment.
Soda ash — the primary raw material for glass manufacturing at approximately 15–20% of production cost — saw price volatility in 2024–2025 that squeezed second-tier manufacturers particularly hard (Mordor Intelligence, 2025). Manufacturers under raw material cost pressure have documented incentives to work at the edge of specification tolerances in ways that are invisible in the short term but visible in long-term field performance data.
How to Audit Suppliers When Alternatives Are Limited
Quality auditing in a consolidated market cannot rely solely on certification documents. IEC 61215 (photovoltaic design qualification), IEC 61730 (safety), and IEC 63092-1 (BIPV-specific requirements) are necessary — but they represent testing completed at a specific point in time, on samples from a specific production run. They do not guarantee current production quality.
Effective auditing in the current market adds: third-party production line visits or video audits (quarterly for primary suppliers), batch-level quality records review (requesting CTQ — Critical to Quality — data on each shipment), trade reference checks with other distributors receiving product from the same production lines, and financial health monitoring (credit agency reports updated annually for suppliers representing more than 30% of your sourcing volume).
For distributors working with manufacturers who operate intelligent MES (Manufacturing Execution System) production management platforms, the quality audit process is materially simplified — because batch-level production data, defect tracking records, and quality inspection results are systematically captured and available for distributor review. Jia Mao BIPV‘s manufacturing infrastructure includes exactly this level of production transparency, with a 3 GW annual capacity facility that provides auditable quality data rather than asking distributors to trust certification documents alone.
2. How Supply Chain Consolidation Is Crushing Your Current Sourcing Strategy
The Margin Squeeze You Are Already Experiencing
Why Consolidation Reduces Competition and Increases Your Costs
Distributor margins in the solar glass market are being compressed from two directions simultaneously — and the combined pressure is more severe than either force would produce alone.
On the supply side: fewer credible alternative manufacturers means you have less negotiating leverage. When there were 15–20 viable Chinese solar glass manufacturers, you could credibly move volume as a negotiating tool. With the market consolidating around 5–7 dominant producers, the threat to switch carries significantly less weight. The manufacturers know your alternatives are limited, and their pricing terms — minimum order quantities, payment terms, freight responsibilities — increasingly reflect that knowledge.
On the demand side: commodity price transparency has increased. Your sophisticated buyers — EPC contractors, commercial glazing companies, building contractors — have access to reference pricing from industry intelligence services and B2B marketplaces that did not exist five years ago. They arrive at your pricing conversations with more benchmark data than they previously had, and they use it.
Real Numbers: The Margin Compression Distributors Are Facing
The table below shows where margins currently sit across product categories, compared to pre-consolidation benchmarks, and the specific pressure points driving the gap:
| Product Category | Pre-2022 Gross Margin | 2025 Gross Margin | Compression | Primary Driver |
|---|---|---|---|---|
| Standard PV cover glass | 18–22% | 10–15% | 7–8% | Commodity pricing transparency + reduced supplier competition |
| Premium monocrystalline glass | 22–28% | 16–21% | 5–7% | VAT rebate elimination + higher freight costs |
| BIPV opaque facade panels | 28–35% | 23–29% | 5–6% | Increased COGS; partially offset by specification value |
| BIPV semi-transparent glass | 33–40% | 28–36% | 4–5% | Strongest margin retention due to specialty positioning |
| Solar roof tiles | 35–42% | 30–38% | 3–5% | Lowest compression; custom spec reduces direct comparison |
Sources: Jia Mao BIPV distributor market data; FactMR Photovoltaic Glass Market Report 2025; distributor profitability analysis.
The pattern in this data carries a clear strategic signal: the products that retain the most margin are those where specification complexity, customization requirements, and technical expertise make direct price comparison difficult. This is not coincidental. It is the market telling you where your product mix should go.
The Lead Time Crisis and Its Operational Consequences
How Extended Lead Times Force an Impossible Choice
The 90-day procurement cycle creates a specific operational dilemma that distributors have to resolve — and there is no cost-free resolution available.
Option A — Lean inventory: Maintain minimal safety stock to limit carrying costs. Accept that stockouts will occur during demand spikes or supply delays. Lose customer orders and relationship credibility when this happens.
Option B — Adequate safety stock: Carry 30–45 days of buffer inventory to maintain service reliability. Accept the carrying cost increase and working capital burden. Protect customer relationships and delivery commitments.
Most distributors who tried Option A in 2023–2024 have already experienced the customer relationship consequences. The distributors maintaining strong customer retention are those who chose Option B and are recovering the carrying cost through the service premium that reliable delivery commands.
The safety stock mathematics are worth understanding precisely. The formula for safety stock that accounts for lead time variability — not just average lead time — is:
Where Z is the service level factor (1.65 for 95% service level), LT̄ is average lead time in days, σ_D is the standard deviation of daily demand, D̄ is average daily demand, and σ_LT is the standard deviation of lead time. For most solar glass distributors, running this calculation with current actual lead time variability produces a safety stock recommendation 2–3x higher than current levels.
The Cash Flow Impact of Carrying Larger Safety Stock
Carrying costs for solar glass inventory — including cost of capital, warehouse space, insurance, and product-specific breakage risk — typically run 20–28% of inventory value per year. For a distributor who increases safety stock from 15 days to 40 days on a USD 2.5 million annual COGS base, the incremental carrying cost is approximately USD 170,000–240,000 per year.
That is a real cost that must be recovered. The recovery mechanism is the pricing premium that reliable delivery commands — and the avoided cost of losing customer accounts to competitors who deliver more reliably.
Why Your Old Forecasting Models Are Failing
Traditional demand forecasting for solar glass used historical order data and seasonal patterns to project forward. That model produced adequate accuracy in a stable, 30-day lead time environment. It consistently fails in the current environment for three specific reasons.
First, the inputs that drive solar glass demand — construction project financing, policy incentive changes, EPC contractor project starts — are more volatile than historical data captures. Second, with 90-day lead times, a forecast error that causes a stockout cannot be corrected quickly; you live with the consequences for the full procurement cycle. Third, BIPV specialty product demand is inherently lumpy and project-driven, making historical order pattern extrapolation particularly unreliable.
The replacement approach is project pipeline-based forecasting: a monthly structured conversation with your top 10–15 customer accounts asking specifically about confirmed, probable, and early-planning projects by product type and volume. This forward-looking intelligence is consistently more accurate for BIPV products than any model built on historical order data.
3. Competitive Positioning: Why Your Traditional Advantages Are Eroding
 The distributors who are maintaining margin and customer loyalty in the current environment are not competing on price — they are competing on the technical expertise and service reliability that large manufacturers cannot cost-effectively replicate at the local market level.
The Disintermediation Threat: Manufacturers Selling Direct
How Direct-to-Customer Sales Threaten Your Role
The economics of manufacturer disintermediation are straightforward: a manufacturer operating at 3 GW annual capacity has the financial resources, logistics infrastructure, and brand recognition to serve large commercial accounts directly in major markets. Their incentive to do so grows as the distributor margin layer increases their effective selling price versus direct competitors.
The signals to watch in your supplier relationships include: whether the manufacturer is offering comparable pricing to large EPC contractors in your territory that they offer to you; whether they are building market-facing commercial teams in regions you serve; and whether they are investing in customer-facing technical resources — specification tools, project design support, installation guidance — that historically required a knowledgeable local distributor to provide.
The manufacturers most likely to attempt disintermediation are those serving large, sophisticated institutional buyers where the distributor’s local knowledge advantage is lowest. A 5 MW commercial solar glass facade project for a corporate real estate developer has a procurement team sophisticated enough to manage direct manufacturer relationships. A 150 kWp BIPV installation for a regional commercial builder does not — and that is where your local expertise, technical support, and service relationship remain genuinely irreplaceable.
Building the Defense That Actually Works
The sustainable defense against disintermediation is not pricing aggression — it is making yourself more valuable to your customers than any direct manufacturer relationship can be. That value is built in three specific dimensions: local inventory (product available in 48 hours, not 90 days), technical depth (specification support, permit documentation, installation guidance at the project level), and relationship intelligence (knowing your customers’ project pipelines, their technical challenges, their decision-making dynamics in ways that take years to accumulate and cannot be transferred).
Price Transparency and Margin Compression
When Everyone Sees the Same Reference Prices
The consolidation of manufacturing into a smaller number of large, publicly listed producers has made solar glass pricing more transparent at the reference level than it has ever been. Industry price reporting services, B2B marketplace data, and the public financial disclosures of listed Chinese manufacturers all contribute to a pricing information environment where your customers arrive better informed than they were three years ago.
This is not inherently a problem — but it becomes one if your value proposition is primarily “I have access to product.” In a transparent pricing environment, that is not a value proposition. It is a commodity position.
The margin defense in a transparent market is value differentiation: making it clear and demonstrable that what you charge above the reference price covers services your customers genuinely value — inventory availability, delivery reliability, technical support, warranty management — and that those services have quantifiable economic value in the context of their projects.
A commercial contractor who has experienced a critical-path glass delivery failure — two weeks late, wrong specification, inadequate packaging — knows exactly what that costs them. When that contractor is evaluating your premium over a reference price, they are doing a different calculation than the customer who has never experienced a supply failure. Build your value story around concrete consequences, not abstract service descriptions.
Customer Expectations You Cannot Meet With a Slow Supply Chain
The Timeline Gap That Is Losing You Deals
Commercial construction project schedules are built on procurement assumptions. If your customers’ project schedules assume 45-day delivery lead times and your supply chain requires 90 days, you have a 45-day gap that shows up as a project delay — and project delays have direct financial consequences for your customers that they will trace back to you.
The practical response is to stop trying to meet legacy delivery expectations with a supply chain that cannot support them, and instead restructure your offering so that your service promise is built around what your supply chain can actually deliver, not what it used to deliver.
This means: maintaining regional inventory for high-velocity standard products (so you can deliver those in 48–72 hours regardless of production lead times), setting clear and accurate lead time expectations for specialty BIPV products (with proactive communication throughout the procurement cycle), and offering forward planning support to customers (helping them structure their procurement 90–120 days ahead of installation schedule, so the lead time is a known variable rather than a crisis).
4. Real Distributor Challenges: What the Market Is Actually Showing
What Adaptive Distributors Are Doing Differently
The Sourcing Moves That Are Generating Measurable Results
Across the solar glass distribution market in 2025, a pattern of effective adaptation has emerged among the distributors who are maintaining or growing margins. These are not theoretical best practices — they are operational decisions with documented business outcomes.
The most consistently effective move is the consignment stock arrangement: negotiating with a primary manufacturer to hold a defined quantity of the distributor’s highest-velocity SKUs at the manufacturer’s facility or a regional transit hub, available for rapid dispatch within 5–10 days of a confirmed order. This arrangement eliminates the production scheduling and manufacturing components of the lead time for pre-positioned product, reducing effective customer lead time from 90 days to 3–4 weeks — without requiring the distributor to carry full inventory cost.
For distributors who have implemented this with manufacturers like Jia Mao BIPV, the consignment arrangement provides a competitive service capability — near-term delivery on specialty BIPV glass — that is extremely difficult for competitors to match without a comparable manufacturing partnership.
The Common Mistakes Distributors Make in Response to Consolidation
Three response patterns that have consistently failed deserve documentation, because they represent common initial reactions that consume resources without generating competitive advantage.
Reactive discounting — reducing prices to retain customers who are exploring alternatives — addresses the wrong problem. A customer exploring alternatives because of repeated delivery failures is not primarily motivated by price. Discounting in that situation trains them to use competitor quotes as leverage without addressing the service reliability issue that prompted the exploration.
Aggressive multi-supplier diversification — simultaneously qualifying five or six new suppliers across multiple geographies — fragments volume commitments in ways that reduce leverage with every supplier and increase administrative complexity without proportional risk reduction. Strategic diversification means one well-qualified alternative, done properly, in one additional sourcing geography.
Waiting for normalization — treating the current supply chain environment as a temporary disruption to be managed until conditions return to pre-2022 norms — is the most costly mistake, because it delays the adaptations that generate competitive advantage while competitors who have already adapted are locking in customer relationships and supplier partnerships.
A Regional Distributor’s Concrete Response
How One Operation Reduced Effective Lead Times by 40%
A mid-size BIPV glass distributor serving commercial construction markets in Northern Europe was operating in 2023 with average customer lead times of 88 days, had experienced four project-critical delivery failures in 18 months, and was watching a competitor with local inventory win specification opportunities that should have been theirs.
Their response had three concrete components. First, they negotiated a reserved production capacity arrangement with their primary Chinese manufacturer — committing to a quarterly volume minimum in exchange for guaranteed production scheduling priority and 15-day dispatch capability for standard specification products. This required a formal volume commitment, but it cut production queue time from 6–8 weeks to under 3 weeks.
Second, they leased 600 square meters of warehouse space in Rotterdam — a strategic location for intra-European distribution — and configured it specifically for vertical glass storage with A-frame racking and specialized handling equipment. They pre-positioned 35 days of stock for their top 6 product SKUs.
Third, they implemented a monthly lead time bulletin sent to all 47 active customer accounts, showing current lead times by product category and explaining the market factors driving them. Customer escalations about lead times dropped by 65% within 60 days — not because lead times improved, but because customers were no longer surprised by them.
The measurable outcome at 12 months: average customer delivery lead time down from 88 days to 31 days for stock items, project delivery failures down to zero, and a 4.2 percentage point improvement in gross margin on BIPV products as delivery reliability enabled confident premium pricing.
5. Rethinking Your Sourcing Strategy for a Consolidated World
Multi-Source Sourcing: Beyond China
Where to Find Alternative Suppliers Without Sacrificing Competitiveness
No alternative manufacturing geography currently matches China simultaneously on cost, product range, quality consistency, and production capacity. Understanding the specific trade-offs of each alternative is the foundation of intelligent diversification.
India is the most developed near-term alternative for standard solar glass and module products. Indian module assembly capacity has expanded significantly, driven by U.S. and European tariff policy creating demand for non-Chinese-origin product. However, most Indian module assembly still sources glass and cell inputs from China — meaning a switch to Indian suppliers provides traceability diversification but not necessarily supply chain independence from Chinese glass manufacturing. For standard products, Indian sourcing can reduce tariff exposure in specific markets; for specialty BIPV glass, Chinese manufacturing capability remains dominant.
European manufacturers offer genuine supply chain independence from China — but at a cost premium of 40–100% above Chinese equivalent products (Evans et al., ScienceDirect, 2025, citing European production costs of USD 0.26/Wp versus Chinese USD 0.13–0.14/Wp). European-sourced solar glass is economically viable for buyers with ESG documentation requirements, tariff exposure on Chinese imports, or premium-segment positioning where the price premium can be passed through. It is not economically viable as a primary sourcing strategy for price-sensitive market segments.
Vietnam and Malaysia primarily assemble using Chinese-sourced glass and cell inputs, providing limited genuine supply chain independence. They can reduce tariff exposure in specific trade policy environments, but they do not meaningfully diversify the underlying production geography.
The sourcing matrix below helps distributors make region-by-region decisions:
| Sourcing Region | Cost vs. China | BIPV Specialty Capability | Avg. Lead Time to EU/US | True Supply Chain Independence | Best Use Case |
|---|---|---|---|---|---|
| China — Tier 1 (Xinyi, Flat Glass, JM BIPV) | Baseline | ممتاز | 55–80 days | Full | Primary source for all specialty BIPV |
| China — Tier 2/3 | −5 to −10% | Limited | 55–80 days | Full | Commodity price reference only |
| India | +12 to +25% | Very limited | 35–55 days | Partial (glass inputs from China) | Tariff hedge for US market standard panels |
| Vietnam / Malaysia | +8 to +18% | Minimal | 40–60 days | منخفضة | Tariff optimization only |
| Europe | +40 to +100% | Growing | 5–15 days (intra-EU) | عالية | ESG-certified / premium-positioned supply |
How to Evaluate an Alternative Supplier Properly
The qualification process for a new supplier — done properly — takes 4–6 months and should not be rushed. It includes: requesting product samples and testing them against your current specification requirements, conducting financial due diligence through a trade credit agency (Coface, Euler Hermes, or Dun & Bradstreet all provide Chinese manufacturer credit assessments), checking references with three or more distributors already sourcing from the same facility in other markets, placing a small qualifying order (5–10% of intended volume) to evaluate order management, documentation quality, and logistics coordination before committing volume, and reviewing certification currency (are all relevant certifications current and from accredited testing bodies?).
Strategic Partnerships With Manufacturers
How to Negotiate When You Have Less Leverage
The negotiating dynamic with consolidated manufacturers has shifted, but leverage has not disappeared entirely — it has changed form. The currencies that large manufacturers value from distributor partners in the current market are different from price demands, and understanding them is the key to improving your commercial terms.
Volume predictability is the highest-value currency. A distributor who commits to quarterly minimum volumes with 70% firm orders and 30% variable provides the manufacturer with production planning certainty that allows them to optimize their own supply chain. Manufacturers value this commitment sufficiently to offer priority allocation, reserved capacity, and pricing improvements that pure transaction buyers cannot access.
Payment reliability and speed is the second most valuable currency. Chinese manufacturers — operating under significant financial pressure in 2025 — have working capital needs that make fast payment genuinely valuable. Offering 15-day net payment in exchange for an early payment discount of 1.5–2% provides you with an annualized return of 27–36% on the deployed capital while providing the manufacturer with working capital they need.
Market intelligence is undervalued by most distributors but highly valuable to manufacturers. Sharing your project pipeline data — which projects are confirmed, which are probable, what specifications they require, what timing they involve — helps the manufacturer plan production scheduling, product development priorities, and market investment. This is a service with real economic value that most distributors provide for free without realizing it is a negotiating asset.
Creating Value Beyond Price for Manufacturers
The distributor relationship that a manufacturer like Jia Mao BIPV genuinely values is not the one that buys the most volume in a single quarter — it is the one that generates consistent, growing volume with low administrative overhead, professional market representation, constructive quality feedback, and customer relationship management that protects and enhances the manufacturer’s brand in markets they cannot serve efficiently through direct sales.
Building that relationship profile requires investing in the operational capabilities that reduce friction in the manufacturer-distributor interface: professional order management with accurate specifications and timely documentation, proactive quality feedback when field issues arise, and market-facing technical knowledge that positions the manufacturer’s products successfully at the architect and engineer specification level.
Building Your Own Buffer Against Consolidation
Strategic Inventory Positioning: What to Stock, Where, and How Much
The inventory positioning framework that works in a 90-day lead time environment is tiered by product velocity and specification complexity:
Tier 1 — High-velocity standard products: Carry 35–45 days of safety stock in your primary warehouse. These are the products your customers order repeatedly, in predictable specifications, where stockouts cost you the most customer relationship capital. Standard BIPV opaque panels, most common transparency-level semi-transparent glass, and standard solar cover glass in your top 3–5 size formats belong here.
Tier 2 — Medium-velocity specialty products: Work with your manufacturer on a consignment or reserved capacity arrangement that provides 10–15 day dispatch availability. You do not carry full inventory cost, but you have committed production access that eliminates the production queue component of the lead time for your customers. Custom BIPV panels in moderate-volume specifications belong here.
Tier 3 — Project-specific custom products: Source against confirmed orders only. Custom-dimensioned BIPV glass manufactured for a specific project — specific size, specific transparency level, specific aesthetic pattern — has no secondary market if the project changes or delays. Never carry speculative stock in this tier.
Regional Warehousing: The Investment Threshold
The regional warehousing investment is justified when you serve a geographic cluster with sufficient volume density to make 48-hour local delivery economically viable. The practical threshold used by the most analytically rigorous distributors: if you have 40 or more active commercial construction customers within a 350km radius, regional warehousing will typically generate ROI within 24 months through customer retention (protecting against competitor delivery-advantage wins), pricing premium (reliable local delivery commands 3–5% premium on affected orders), and avoided emergency freight costs.
The infrastructure investment for glass-specific regional warehousing — A-frame vertical racking systems, specialized glass-handling equipment, forklift attachments for panel handling, climate-controlled space for sensitive BIPV products — typically runs USD 70,000–180,000 depending on facility size and specification. This is not overhead cost. It is the capital investment in a service capability that competitors without regional warehousing cannot match.
6. Technology and Data: Building the Operational Intelligence Advantage
 Supply chain visibility — knowing where every shipment is at every stage, with enough advance warning to communicate proactively to customers — is the operational capability that turns a 90-day lead time from a liability into a managed commitment.
Supply Chain Visibility Tools
How Real-Time Tracking Manages the 90-Day Window
Supply chain visibility is the operational capability that transforms long lead times from a source of customer relationship risk into a managed, communicable commitment. Without visibility, a 90-day lead time is 90 days of uncertainty that ends either with product arriving on time or an emergency call to a customer whose project schedule just moved. With real-time tracking, you know at each stage — production scheduled, manufacturing completed, vessel departed, in transit, at port, customs cleared, in-country transit — whether your delivery commitment is on track, and you have enough advance warning of disruptions to manage them before they become customer crises.
The supply chain visibility software market is growing from USD 2.5 billion in 2025 to a projected USD 12.6 billion by 2035 (Market.us, 2025), reflecting the widespread recognition across industries that visibility is a competitive necessity. For solar glass distributors, the platforms with the highest practical value are those that integrate with container tracking APIs (for ocean freight monitoring), support customs and compliance document management, and provide customer-facing order status portals that reduce inbound status inquiry calls.
Platforms specifically relevant to solar distribution include Sunhub’s supply chain management tools, TradeVerifyd for supplier verification and compliance tracking, and the SEIA Solar & Storage Supply Chain Dashboard for market-level intelligence on pricing and availability trends.
Which Features Matter Most for Solar Glass Distributors
The functionality hierarchy for solar glass distributors evaluating visibility platforms: container-level tracking with automated milestone notifications (highest priority), document management for customs, certifications, and quality records (high priority), customer-facing order status capability (high priority), integration with your existing ERP or inventory management system (medium-high priority), and demand analytics and forecasting capability (medium priority — valuable but can be addressed with a separate dedicated tool).
Demand Forecasting in Volatile Markets
Why Historical Data Cannot Carry the Full Load
Traditional demand forecasting for solar glass — built on historical order patterns, seasonal adjustment factors, and simple growth trend assumptions — produced adequate accuracy in a stable, 30-day lead time environment. It fails in the current environment for a specific reason: the inputs that drive demand change faster than historical data captures them, and with a 90-day lead time, a forecast error that creates a stockout cannot be quickly corrected.
The approach that consistently outperforms purely statistical forecasting for BIPV specialty products is project pipeline integration. Once per month, your account managers conduct structured conversations with your top 10–15 customer accounts, collecting: confirmed projects (product type, volume, delivery date), probable projects (product type, estimated volume, estimated timing, probability assessment), and early-stage projects (product type, rough volume, rough timing). This pipeline data — aggregated across accounts — provides demand signals 6–12 months forward that historical order data cannot generate.
Layer scenario-based assumptions on top of pipeline data: a conservative case (assume 15% of probable projects don’t proceed), a base case (assume the pipeline proceeds as assessed), and an upside case (assume 20% additional volume from wins not yet in the pipeline). Size your inventory to handle the base case comfortably. Define the trigger point — what demand level activates an emergency procurement response — for the upside case.
Automated Reordering Systems
Setting Reorder Points That Reflect Current Reality
Automated reordering systems are valuable for high-velocity standard products where demand is relatively predictable and lead time is the primary variable. The reorder point formula for a 90-day lead time environment with lead time variability:
Where D̄ is average daily demand and LT̄ is average lead time in days. If your average daily demand for a standard BIPV panel SKU is 0.4 units and your average lead time is 88 days with a standard deviation of 12 days, and you are targeting 95% service level, your reorder point calculation will typically produce a number that surprises distributors accustomed to 30-day lead time parameters. Recalculate your reorder points using current actual lead times — not the lead times your system was configured for in 2021.
Automated systems should include human override capability for any order that would represent more than 30 days of typical demand — project-driven demand spikes can cause automated systems to generate orders that are economically inappropriate for the specific product context.
7. Protecting Your Customer Relationships During Supply Chain Disruption
Transparency as a Competitive Weapon
How Honest Lead Time Communication Wins Customer Trust
The most counterintuitive finding from distributor customer retention analysis in the current supply chain environment is this: customers are not defecting because lead times are long. They are defecting because lead times were misrepresented and then revised upward after the customer had committed to a project schedule built on the shorter timeline.
The distributors with the highest customer retention rates in a 90-day lead time environment are those who set accurate expectations before any order is placed, communicate proactively throughout the procurement cycle, and provide early warning of disruptions before the customer discovers them through a missed delivery. This approach trades short-term deal risk (some customers will choose a competitor who quotes a shorter — possibly unrealistic — lead time) for long-term relationship stability.
The monthly lead time bulletin is the specific tool that the most effective communicators in the market have implemented. It is a single-page document, organized by product category, showing current lead times for each product type in your portfolio, along with a brief market context explanation. Distributed proactively to all active customer contacts on the first business day of each month, it sets expectations before orders are placed, demonstrates market knowledge, and signals that you manage your supply chain actively rather than reactively.
The Language That Converts Lead Time Anxiety Into Trust
The specific framing that works in customer lead time conversations: “Our current lead time for this product is 85 days from order to your site. Here is how we manage that for you: [consignment stock for high-velocity products], [production priority confirmation within 72 hours of order], [weekly status updates from vessel departure through customs clearance], [dedicated escalation contact for any project-critical timeline concern].” This is not apologizing for the lead time. It is demonstrating that you manage the supply chain on your customer’s behalf with professional infrastructure they cannot access by sourcing direct.
Value-Added Services: Building the Moat That Protects Your Role
Technical Support That Justifies Your Existence in a Consolidated Market
The competitive threat from manufacturer disintermediation has a structural blind spot: manufacturers operating at scale in Chinese production centers cannot cost-effectively provide the local, project-level technical support that commercial construction customers need when they encounter specification questions, building permit requirements, installation challenges, or warranty claims on a project timeline.
The technical support services that create the deepest customer dependency are those that become embedded in the customer’s project workflow. A commercial glazing contractor whose project engineer has called your technical team three times for structural load calculation support, building permit documentation preparation, and electrical integration specification on a BIPV project is not going to risk their project timeline by switching to a new supplier who cannot provide that same support. The switching cost is not about price — it is about the project risk of losing a technical resource they rely on.
For distributors working with Jia Mao BIPV’s product portfolio, the technical differentiation built into the manufacturer relationship includes: products tested and certified to IEC 63092-1 BIPV-specific building material requirements, installation documentation prepared for multiple market building code environments, and a manufacturer technical team that can provide project-specific consultation for unusual specification requirements. This manufacturer-level technical depth, channeled through a distributor with local market knowledge, is the combination that competitors cannot easily replicate.
Installation Guidance and Training as Retention Tools
The service that creates the most durable customer relationship is training. A commercial glazing contractor whose installation crew has been formally trained on your BIPV glass handling procedures — the specific A-frame transport requirements, edge protection standards, waterproofing integration protocols, and electrical connection details for the products you supply — has effectively made you part of their operational infrastructure. The retraining cost, the installation error risk during a learning curve with a new supplier’s products, and the loss of the relationship with your technical team all represent switching costs that dwarf any price variation a competitor can offer.
Building Long-Term Contracts That Protect Both Sides
Contract Structures That Work in a Volatile Supply Chain
The long-term supply contract that protects distributor margins in the current environment has three non-negotiable elements: a volume commitment that gives your supplier production planning certainty, a cost-adjustment mechanism that passes verified input cost changes through to the customer on a defined formula and notice period, and a service level agreement that defines your delivery commitments in measurable terms and provides defined remedies for underperformance.
The cost-adjustment mechanism is the element most distributors are missing from their customer contracts, and its absence is the primary reason that input cost increases (VAT rebate elimination, soda ash price spikes, freight rate surges) compress distributor margins rather than being passed through to customers.
A practical cost-adjustment clause links customer pricing to a published, verifiable raw material or logistics cost index — OPIS for energy costs affecting freight, publicly available soda ash price indices for glass raw materials, or a composite index agreed by both parties. When the index moves beyond a defined threshold (typically +/−8%), the pricing adjusts on the next invoice cycle with 30 days written notice. Customers who understand that your pricing is tied to real and verifiable cost movements accept these adjustments more readily than they accept arbitrary price increase announcements.
8. Financial Resilience: Managing Cash Flow in a Consolidated Supply Chain
Working Capital Challenges
The Cash Flow Mathematics of a 90-Day Supply Chain
The cash flow arithmetic of a 90-day procurement cycle is materially more demanding than a 30-day cycle — and most distributors have not adjusted their credit facilities and working capital management accordingly.
Under a 30-day lead time model with 30-day customer payment terms: you pay for goods approximately 30 days after order, receive them at 30 days, sell and invoice at 35 days, collect at 65 days. Cash cycle: approximately 35 days.
Under a 90-day lead time model with the same payment terms: you pay for goods 30 days after order, receive them at 90 days, sell and invoice at 95 days, collect at 125 days. Cash cycle: approximately 95 days — nearly 3x longer, requiring nearly 3x the working capital to support the same revenue level.
For a distributor generating USD 4 million in annual revenue, this working capital gap — unaddressed — is a USD 500,000–700,000 financing requirement that either constrains growth, forces expensive credit line increases, or limits the safety stock investment needed for service reliability.
Strategies to Bridge the Payment Gap
The working capital management approaches that are most effective in the current environment:
Supply chain finance programs: Several trade finance providers now offer solar supply chain-specific programs that advance payment to your supplier at the time of shipment against your confirmed purchase orders, with repayment from your accounts receivable collection. This bridges the payment-to-collection gap at lower cost than traditional revolving credit facilities.
Customer early payment incentives: Offering customers a 1.5–2% discount for payment within 10 days of delivery provides you with an annualized return on the credit provided of 27–36% — typically higher than your cost of credit — while improving your cash cycle from 30+ days to 10 days on participating accounts.
Consignment stock arrangements: As discussed in Section 5, consignment stock with your primary manufacturer reduces your working capital requirement significantly by deferring your payment obligation until the product is sold rather than when it is ordered.
Hedging Against Price Volatility
Protecting Margins When Raw Material Costs Fluctuate
Soda ash — the primary raw material for glass manufacturing — directly affects your COGS through its impact on manufacturer pricing. Soda ash demand is projected to increase by 6% in 2025, driven primarily by solar glass production scaling (Chemical Market Analytics, 2025). As solar glass production grows faster than soda ash supply capacity in some regions, price spikes are a structural risk for the solar glass supply chain.
The practical hedge available to most distributors is not financial instrument-based (forward contracts on soda ash are not accessible to most distribution businesses) — it is contract-based: negotiating customer pricing agreements with explicit cost-adjustment mechanisms tied to soda ash price indices, and negotiating supplier agreements with pricing locks for defined periods in exchange for volume commitments.
Forward purchasing — buying inventory at current prices when market intelligence signals near-term cost increases — is the distributor-level equivalent of commodity hedging. When your manufacturer signals that raw material costs are increasing and they will pass the increase through in 60 days, purchasing additional inventory at current prices before the increase takes effect is financially rational, as long as you have storage capacity and the inventory turns within a reasonable period.
Scenario Planning: Stress-Testing Your Business Model
Three Scenarios Every Solar Glass Distributor Should Model
Effective scenario planning is not about predicting the future — it is about ensuring your business can function profitably across multiple possible futures, not just the one you expect.
Scenario A — Deepened Consolidation: China’s manufacturing dominance intensifies, additional trade policy measures restrict sourcing alternatives, and lead times extend further to 100–120 days. Business response: accelerate regional warehousing investment, deepen consignment stock arrangements, accelerate product mix shift toward BIPV specialty products where commodity competition is less intense.
Scenario B — Geopolitical Disruption: Trade policy changes (expanded tariffs, export controls, or supply disruptions from a major manufacturing region) create sudden supply scarcity or major cost increases. Business response: activate pre-built alternative supplier relationships, pre-position emergency inventory for highest-priority customers, communicate transparently with customers about market conditions and timeline impacts.
Scenario C — Demand Acceleration: BIPV demand surges faster than supply responds — driven by building energy mandates, corporate sustainability commitments, or policy incentives — creating product scarcity and pricing power for distributors with established supplier relationships. Business response: maximize forward purchasing commitments with primary manufacturer, use allocation priority as a customer loyalty reward, accelerate conversion of customer relationships to multi-year volume agreements.
9. The Path Forward: Adaptation Moves That Generate Real Results
Short-Term Wins: What You Can Do in the Next 90 Days
Immediate Sourcing Changes That Reduce Lead Time Exposure
The highest-impact 90-day move for most solar glass distributors is initiating a consignment stock negotiation with your primary manufacturer. The conversation is straightforward: commit to a defined quarterly volume minimum in exchange for the manufacturer holding a reserved inventory position of your top 3–5 SKUs at their facility or a regional transit hub, available for dispatch within 10 days of a confirmed order.
This negotiation is most successful when you bring: a specific volume commitment (with historical order data to substantiate it), a payment terms commitment (offering 30-day or faster payment), and a market intelligence package (your project pipeline for the next two quarters, giving the manufacturer planning visibility). The combination of these offers a compelling value exchange for most manufacturers.
Immediate Cost-Saving Opportunities
Audit your current freight arrangements against current market rates. Ocean freight rates are volatile enough that distributors who have not benchmarked their freight costs in the past 6 months are very likely paying above current market rates on at least some routes. Request competing quotes from two freight forwarders for your next three significant shipments — savings of 8–15% on ocean freight are common for distributors who have not recently re-bid.
Review whether your supplier relationships qualify for early payment discounts. If you are paying 30-day net and your supplier offers a 1.5–2% discount for 10-day payment, the annualized return on that working capital deployment is 27–36% — almost certainly higher than the cost of your credit line and meaningfully higher than any alternative low-risk deployment of that capital.
Medium-Term Repositioning: The 6–12 Month Strategic Build
Building Alternative Supplier Relationships
The six-to-twelve month window is the appropriate timeframe for qualifying a second sourcing geography — done properly. Identify one credible alternative supplier in a region that provides genuine supply chain differentiation (for most distributors, this is an Indian manufacturer for standard products or a European manufacturer for ESG-certified supply). Place a formal qualifying order. Evaluate documentation quality, logistics coordination, product specification accuracy, and order management professionalism before committing volume.
This is not a sprint. A qualification process completed in 60 days that results in a primary-dependency relationship with a supplier whose financial stability was not properly assessed, whose product specifications were not independently tested, and whose logistics capability was not stress-tested is more dangerous than no diversification at all.
Investing in Technology and Inventory Infrastructure
The technology and infrastructure investments that generate the clearest ROI in this horizon are: supply chain visibility software (USD 500–3,000/month, payback typically 6–9 months), demand forecasting tools with pipeline integration capability (USD 300–1,500/month), and regional warehouse infrastructure if volume thresholds are met (USD 70,000–180,000, payback typically 18–28 months).
Prioritize visibility software first — it addresses the most acute operational problem (customer lead time management) and has the fastest payback. Warehouse infrastructure is the larger investment with the larger strategic impact; it should be sized and sited based on a careful customer density and volume analysis before committing capital.
Long-Term Competitive Positioning: The 1–3 Year Transformation
Becoming an Indispensable Partner Despite Consolidation
The three-year business transformation that makes a solar glass distributor genuinely defensible against both manufacturer disintermediation and continued supply chain consolidation is a repositioning from product supplier to technical solutions partner. This is a specific operational and commercial transformation, not a marketing reframe.
A technical solutions partner in the BIPV glass market provides: project specification support from the design stage (working with architects, energy consultants, and building engineers to specify the right product for each application), procurement management (managing the complex multi-source supply chain on the customer’s behalf), technical commissioning support (ensuring electrical integration, performance verification, and building code compliance after installation), and ongoing maintenance planning (supporting the 25-year performance warranty through periodic inspection protocols and warranty claims management).
For the commercial glazing companies, EPC contractors, and building developers who are the core customer base for BIPV glass distribution, this bundle of services eliminates the need for in-house expertise that most mid-size firms cannot economically maintain. It creates switching costs that are fundamentally different in kind from product pricing — they are not overcome by a competitor’s 3% price reduction, because the cost of replacing the expertise relationship is far higher than the price differential.
Evolving From Product Distributor to Solutions Provider
Distributors who have made this transition in adjacent specialty building materials markets report gross margins 25–35% higher on solutions-oriented revenue than on equivalent product-only revenue — because the expertise differential is genuine, and sophisticated commercial buyers will pay for it.
The transition requires investment in human capital (technical staff who can support BIPV specification and project management), systems (CRM with project pipeline tracking, documentation management for permits and certifications), and time (the reputation as a technical expert is built over years, not months). Start with the customers where technical support is most valued — large commercial EPC contractors and architectural glazing specialists — and build the model there before extending it.
Explore how Jia Mao BIPV’s distributor partnership program supports this transition, including access to technical specification documentation, project design consultation resources, and manufacturer-level certification data that give distributor technical teams the depth to serve commercial construction clients credibly.
10. Industry Trends: What Is Coming Next
Consolidation Will Continue
Preparing for Further Concentration
The capital economics of solar glass manufacturing favor continued consolidation. Glass melting furnaces require minimum economic scales of 500–1,000 tonnes per day; the investment required for a competitive facility runs USD 200–500 million for a facility of meaningful scale. These economics create a structural barrier to entry that protects large incumbents and eliminates smaller competitors over time.
Chinese solar manufacturers’ collective financial losses in 2025 will accelerate this process — manufacturers that cannot achieve operating profitability will be acquired by or merged into larger, more efficient producers, reducing the number of independent suppliers further. For distributors, this means the negotiating environment will become progressively more challenging as the supplier landscape consolidates.
Geopolitical Factors That Could Reshape Sourcing Overnight
The April 2026 elimination of China’s VAT export rebate on solar products is not the last policy-level shock the distribution industry will absorb. Active trade policy developments that every solar glass distributor should be tracking include: U.S. Section 301 tariff developments and any extensions or expansions to solar glass and BIPV specifically, EU anti-dumping and countervailing duty investigations and their timeline for resolution, and China’s continuing evolution of export policy as it manages domestic overcapacity against international trade pressure.
Building a supply strategy that functions under multiple trade policy scenarios — not just the current baseline — is the risk management work that separates well-prepared distributors from those who will be scrambling when the next policy change arrives. The IEA Solar PV Global Supply Chains Executive Summary provides the most authoritative ongoing reference for this geopolitical context.
Technology Integration: The Coming AI Wave
AI and Predictive Analytics Entering Solar Glass Distribution
AI-powered demand forecasting, supplier risk monitoring, and logistics optimization are moving from early adopter experimentation to practical commercial deployment for mid-market distribution businesses. The distributors who are implementing these tools now are building information asymmetry advantages — proprietary data assets, optimized operational habits, and institutional knowledge embedded in their systems — that will be genuinely difficult for later adopters to replicate.
The supply chain visibility software market’s growth from USD 2.5 billion in 2025 to USD 12.6 billion by 2035 is the market’s quantification of how broadly this judgment is shared across industries. Solar glass distribution is earlier in this adoption curve than adjacent industries — which means the early adopter advantage is still available, but the window is measured in months, not years.
▶ Watch: Solar Supply Chain Transparency — Navigating Import Compliance and Sourcing Risk
A practical session covering supply chain traceability, import compliance requirements, and the risk mitigation strategies that are shaping how distributors approach sourcing decisions in 2025 and beyond.
Sustainability Pressures and ESG Compliance
ESG as a Commercial Prerequisite
ESG compliance requirements in solar glass supply chains have crossed the threshold from voluntary best practice to commercial prerequisite in the institutional market — and the institutional market is precisely where BIPV glass commands the highest margins.
The Solar Stewardship Initiative (SSI) released its first ESG site certificates in January 2025, with additional certifications anticipated throughout the year (Solar Energy UK Supply Chain Briefing, 2025). SSI certification is rapidly becoming the preferred documentation standard for institutional buyers — corporate real estate developers, government infrastructure programs, university campuses — who have their own ESG reporting obligations that require supply chain documentation from their suppliers.
The EU Corporate Sustainability Due Diligence Directive (CSDDD) requires large companies operating in the EU to conduct documented due diligence across their supply chains for environmental and human rights impacts — a requirement that flows directly to solar glass distributors as the supply chain intermediary for their European commercial construction customers.
The Opportunity Embedded in the Compliance Requirement
The distributor who invests in supply chain ESG documentation infrastructure — traceable batch records, factory audit reports from accredited third-party auditors, carbon footprint calculations per product unit, labor compliance certifications — is not just managing a compliance requirement. They are creating a commercial differentiator that is worth a 5–8% price premium in the institutional project segment, based on documented market pricing for ESG-certified versus uncertified supply in adjacent construction material categories.
Work with manufacturers who maintain transparent, auditable production records to develop the documentation that supports your ESG claims. For distributors working with Jia Mao BIPV, the MES production management system provides the batch-level traceability and quality data that forms the factual foundation of a credible ESG supply chain documentation package.
For the compliance framework that institutional buyers are referencing, the IRENA Solar PV Supply Chains Technical and ESG Standards report is the authoritative international reference.
 The institutional commercial construction market — where ESG-certified BIPV glass commands 5–8% price premiums — is precisely the segment where distributors who invest in supply chain documentation infrastructure capture the highest margins.
Adaptation Is Survival
Why Distributors Who Act Now Will Thrive
The supply chain disruption you are navigating is not a temporary market dislocation. It is a structural reorganization of an entire global industry’s manufacturing geography — driven by capital investment patterns, scale economics, and policy developments that have been building for a decade and will not reverse quickly.
The window for adaptation is not indefinitely open. The distributors who have already established regional warehousing, qualified alternative suppliers, negotiated consignment stock arrangements, and deepened their technical service capabilities are not working years ahead of the market. They are working now, in parallel with the first wave of competitors who recognized the structural nature of the shift. The second wave — those who adapt after the first-movers have locked in customer relationships and supplier partnerships — will find both moves more expensive and less differentiated than they are today.
Your competitors are already moving. The distributor who has established a consignment stock arrangement and cut effective customer lead times from 90 to 25 days is visible in your market. Their customers talk. Some of those customers are yours.
The distributors who will thrive in the consolidated solar glass market over the next five years are not necessarily the largest, the best-capitalized, or those with the most supplier relationships. They are the most adaptive: those who build regional inventory infrastructure that competitors cannot match, develop technical expertise that customers depend on, establish supplier partnerships that provide allocation priority and flexibility, and communicate with transparency that builds the trust that price shopping erodes.
The framework is clear. The moves are specific. The window is now.
The solar glass distribution landscape is shifting beneath your feet. The question is not whether you will adapt — it is whether you adapt fast enough to stay ahead of your competition.
Your next move: Schedule a consultation with our supply chain specialists to audit your current sourcing strategy and identify the 3–5 highest-impact changes you can make in the next 90 days.
Don’t wait for consolidation to force your hand. Take control of your supply chain strategy today.
Schedule Your Supply Chain Strategy Consultation →
Explore Jia Mao BIPV’s Distributor Partnership Programs →
View Real-World BIPV Project Case Studies with Performance Data →
Glossary of Key Terms
BIPV (Building-Integrated Photovoltaics): Solar electricity generation technology incorporated directly into building materials — glass facades, roof tiles, skylights, curtain walls — replacing conventional building components rather than being mounted separately. BIPV glass is the highest-margin specialty segment within solar glass distribution, typically commanding 10–15 percentage points higher gross margin than commodity solar cover glass.
Supply Chain Consolidation: The concentration of manufacturing capacity among a smaller number of larger producers. In solar glass, this has reduced the number of viable Chinese manufacturer alternatives from approximately 20 credible producers in 2019 to 5–7 dominant manufacturers in 2025, shifting negotiating leverage toward manufacturers.
Lead Time: The total elapsed time from purchase order placement to product receipt at the buyer’s location. Currently 75–95 days for standard solar glass from Chinese manufacturers to Western markets; 12–20 weeks for custom BIPV specialty products.
Safety Stock: Inventory held above expected demand during a lead time period to buffer against supply delays and demand variability. Safety stock is not waste — it is the quantifiable cost of service reliability in a volatile supply chain. Calculate it using actual current lead times and lead time variability, not historical norms.
Consignment Stock: A supply arrangement where the manufacturer retains ownership of inventory stored at or near the distributor’s location until the distributor sells the product. Reduces distributor working capital requirements while maintaining product availability — the most capital-efficient buffer stock mechanism in the current market.
Cost-Pass-Through Clause: A contract provision allowing the selling price to adjust based on documented changes in verified input costs (raw materials, freight, currency). Essential margin protection in a volatile supply chain, and standard commercial practice for sophisticated B2B buyers.
VAT Export Rebate: A Chinese government policy historically refunding a portion of value-added tax on exported goods, effectively subsidizing export prices. The elimination of the 9% solar product VAT export rebate effective April 2026 added approximately 9% to effective Chinese solar glass export costs — affecting every Chinese manufacturer simultaneously.
MES (Manufacturing Execution System): A digital production management platform tracking all manufacturing stages — scheduling, material flow, quality control, batch traceability — in real time. MES data provides the production transparency that supports quality auditing, warranty claims, and ESG documentation requirements.
ESG (Environmental, Social, and Governance): A framework of criteria for evaluating a company’s or supply chain’s sustainability and ethical practices. In solar glass distribution, ESG compliance increasingly means providing customers with traceable supply chain documentation, factory audit reports, carbon footprint data, and labor compliance certifications as commercial prerequisites for institutional project supply.
Disintermediation: The process by which manufacturers bypass distributors to sell directly to end customers. In solar glass, disintermediation risk is highest for commodity products in large markets where manufacturer direct sales infrastructure is economically viable, and lowest for specialty BIPV products requiring local technical expertise.
Scenario-Based Forecasting: A demand and financial planning approach maintaining multiple concurrent projections under different market assumptions — conservative, base, and upside cases — rather than committing to a single forecast. Enables inventory and capital planning that remains functional across a range of market outcomes.
FAQs: Your Most Pressing Questions Answered
Q1: How much longer will solar glass lead times stay at 60–90 days?
The structural factors driving 60–90 day lead times — manufacturing consolidation, high-utilization order books at dominant producers, ocean freight transit geography — are not resolving within the next 12–18 months based on current supply chain conditions. Plan for this as the operational baseline, not an exception to manage around. BIPV specialty products with custom specifications should be planned on 12–20 week timelines permanently, as custom manufacturing is inherently longer than standard production runs regardless of market conditions. Recalibrate your customer delivery commitments and inventory strategy around current reality, not the pre-2022 environment.
Q2: Should I diversify my sourcing beyond China?
Yes — strategically and sequentially, not simultaneously across multiple regions. The effective approach is identifying one credible alternative supplier in a genuinely independent supply chain geography, qualifying them properly over 4–6 months, and building that relationship to a meaningful volume share (15–25% of total sourcing) before pursuing additional diversification. India is the most developed near-term option for standard products; European manufacturers for ESG-certified or tariff-protected supply. Maintain your primary Chinese manufacturer relationships — you need both, and fragmenting volume across too many suppliers simultaneously reduces leverage with all of them.
Q3: Is my current inventory strategy still valid?
For the majority of solar glass distributors, no. Just-in-time inventory principles were calibrated for 30-day lead times. When lead times triple, safety stock requirements approximately triple as well. Recalculate your safety stock requirements using actual current lead times and lead time standard deviation — most distributors will find their current safety stock levels are 50–70% of what the mathematics of the current supply chain require. The carrying cost increase is real and must be recovered through service premium pricing and customer retention, not denied.
Q4: How do I compete with manufacturers selling directly to my customers?
Build capabilities that manufacturers cannot cost-effectively replicate at your local market level: local inventory available for 24–48 hour delivery (not 90-day import), technical expertise at the project level (specification support, permit documentation, installation guidance), and relationship depth with your customers’ project teams that takes years to accumulate. The manufacturers most likely to disintermediate successfully are those serving large, sophisticated institutional buyers with commodity products. Specialty BIPV glass requiring local technical support is precisely where your indispensability is most durable.
Q5: What is the real margin impact of supply chain consolidation?
Most solar glass distributors are experiencing 5–8 percentage point gross margin compression on specialty BIPV products and 7–10 percentage points on commodity solar glass, attributable to consolidation-related factors — increased COGS from reduced supplier competition, higher logistics costs, and pricing pressure from better-informed customers. The most effective offsets are product mix improvement toward higher-margin BIPV specialty products (where specification complexity reduces direct price comparison), operational cost reduction in logistics and inventory management, and service differentiation that commands pricing premiums.
Q6: Should I invest in regional warehousing, and how do I know if the numbers work?
The investment is justified when you serve 40 or more active commercial construction customers within a geographic cluster where 48-hour local delivery is achievable from a single facility. The ROI calculation includes: customer retention value (protecting against competitor delivery-advantage wins, typically worth 5–8% of at-risk annual revenue), pricing premium (reliable 48-hour delivery commands 3–5% premium on affected orders), and avoided emergency freight costs. For most distributors with sufficient customer density, payback is 18–28 months. The infrastructure investment — A-frame racking for vertical glass storage, specialized handling equipment — runs USD 70,000–180,000 depending on scale.
Q7: How do I negotiate better terms with consolidated suppliers?
Offer volume predictability (quarterly minimum commitments with 70% firm orders), payment speed (15-day net with early payment discount in exchange for 1.5–2% discount), and market intelligence (sharing your project pipeline data). These currencies matter to manufacturers more than price demands, and they are the basis for consignment stock arrangements, priority allocation, and pricing improvements that transactional buyers cannot access. The manufacturer who treats you as a strategic market partner rather than a transactional buyer will provide better commercial terms — and earning that status requires demonstrating the operational reliability and market knowledge that a strategic partner provides.
Q8: What technology should I invest in first?
Supply chain visibility tools are the highest-priority first investment for most distributors, because they directly address the most acute operational problem — managing customer expectations and delivery commitments under 90-day lead times. Realistic monthly cost: USD 500–3,000 depending on transaction volume and feature set. Payback: typically 6–9 months through reduced emergency freight costs, reduced customer escalation overhead, and customer retention. Demand forecasting tools with pipeline integration are the second priority, addressing the inventory planning challenge. Warehouse management infrastructure comes third — larger investment, larger strategic impact, longer payback.
Q9: Is this supply chain consolidation permanent?
Yes, with high confidence for a 5–10 year planning horizon. The capital investment that created China’s manufacturing dominance in solar glass — purpose-built glass melting furnaces, vertically integrated raw material supply chains, decades of accumulated manufacturing expertise — represents sunk costs that do not reverse based on market price signals or short-term policy changes. Plan for the current environment as the permanent baseline. The geopolitical overlay may make it more complex (additional tariffs, export controls, trade restrictions) rather than simpler — additional reason to build supply chain resilience now.
Q10: How do I explain longer lead times to customers without losing the deal?
Set accurate expectations before any order is placed — not after the customer has already committed to a project schedule. A monthly lead time bulletin distributed proactively to all active customers, showing current lead times by product category, is the most effective tool. When discussing a specific order, frame the lead time management service you provide: production scheduling confirmation within 72 hours, vessel departure notification, customs clearance tracking, final delivery coordination. Customers who understand that you actively manage the supply chain on their behalf — rather than just placing orders and hoping — are significantly more tolerant of longer timelines than customers who feel they have been quoted optimistic numbers and left to manage the consequences.
Q11: Can I remain profitable as a solar glass distributor in the current market?
Absolutely — but not with the same business model that worked in 2021. The distributors maintaining and growing profitability are those who have moved their product mix toward higher-margin BIPV specialty products, invested in the service capabilities that command price premiums (local inventory, technical expertise, logistics precision), and built supplier relationships that provide allocation priority and consignment stock arrangements. The profitability path is real and achievable. It requires the adaptation investments described in this guide, not a favorable market environment that has not yet returned and may not return.
Q12: What is the biggest strategic mistake distributors are making right now?
Treating the current supply chain environment as a temporary disruption to be endured until conditions normalize. Every quarter spent managing the current supply chain with the old operating model — while competitors build regional warehouses, qualify alternative suppliers, and deepen technical service capabilities — is a quarter of competitive ground that is difficult to recover. The structural nature of the shift is now clear. The distributors who act decisively in 2025 will capture market share from those who wait.
Q13: How do I verify that a supplier is financially stable enough to be my primary source?
Do not rely on size or brand recognition as proxies for financial stability. Chinese solar manufacturers collectively posted significant losses in 2025, including large, recognizable names. Verification requires: a credit agency report (Coface, Dun & Bradstreet, or Euler Hermes for Chinese manufacturers), trade references from three or more distributors currently sourcing from the same facility, monitoring of public press for payment delays to their own suppliers or capacity curtailments (early financial stress signals), and annual review of certification currency (financially stressed manufacturers may let third-party certifications lapse as a cost-cutting measure).
Q14: Should I build long-term contracts with customers?
Yes — with appropriate cost-adjustment mechanisms built in. Long-term supply agreements protect margins by providing revenue predictability, reducing customer acquisition cost, and enabling supply chain commitments to your own manufacturers. The essential protection is a documented cost-adjustment provision linked to a verifiable material or logistics cost index, with a defined threshold and notice period. Without this protection, a multi-year fixed-price contract becomes a loss-making obligation if your COGS spike due to policy changes, raw material cost increases, or freight rate surges.
Q15: What is the best demand forecasting approach for BIPV specialty products?
Project pipeline-based forecasting — structured monthly conversations with your top 10–15 customer accounts collecting confirmed, probable, and early-planning project data by product type and volume — is consistently more accurate for BIPV specialty products than statistical extrapolation from historical orders. BIPV demand is project-driven and episodic; individual large projects can represent months of typical demand, making historical pattern extrapolation unreliable. Layer scenario assumptions (conservative, base, upside) on top of pipeline data, size your inventory for the base case, and define the emergency procurement trigger points for the upside scenario. This approach will not eliminate forecast error, but it will materially reduce the frequency and severity of the stockouts and overstock situations that most damage profitability.
For ongoing intelligence on solar glass supply chain dynamics, manufacturer financial performance, and sourcing diversification options, the following resources provide the most reliable and regularly updated data relevant to distributor strategic planning:
- IEA Solar PV Global Supply Chains — Executive Summary — the authoritative reference for China’s structural role in global solar manufacturing
- SEIA Solar & Storage Supply Chain Dashboard — regularly updated pricing, import volume, and supply chain trend data
- Jia Mao BIPV — Product Portfolio and Distributor Partnership Programs — full BIPV product range, technical specifications, and partnership programs for distributors seeking a manufacturer with 3 GW capacity and 25-year performance guarantees
- Jia Mao BIPV — Solar Glass vs. Traditional PV Panels: The 2025 Analysis — margin comparison data and distribution strategy insights for product mix decisions
- IRENA Solar PV Supply Chains Technical and ESG Standards — the compliance framework that institutional buyers and regulators reference for supply chain ESG requirements




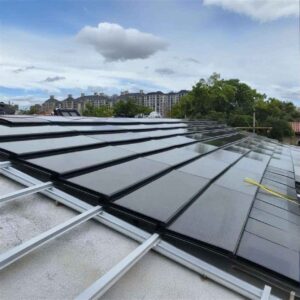
-300x300.jpg)