Advanced Tips to Maximize Performance and Value from Building Integrated Photovoltaic (BIPV) Panels — A Strategic Guide for Industry Professionals
 The most expensive thing in BIPV is not the glass. It is the performance that was never captured because nobody was watching closely enough.
This guide is written for curtain wall and roofing contractors, photovoltaic EPC and energy service providers, building material brands and distributors, and architects, engineering consultants, and design institutes. If your firm delivers, specifies, or maintains BIPV systems, every section here addresses a problem you will encounter — or are already paying for.
The global BIPV market reached USD 23.4 billion in 2025 and is projected to exceed USD 89.8 billion by 2030 — growing at a 21.2% compound annual rate. Behind that number are thousands of building owners who have made a 25-year financial commitment to facades, rooflines, and skylights that generate electricity.
Most of those commitments will be kept only if the professional teams managing those buildings move beyond a “set-and-forget” relationship with the system. Well-maintained BIPV installations retain 95% of their original capacity after 20 years. Poorly managed ones drop to 85% or lower — a gap worth $180,000–$240,000 in lost energy value on a single 500 kW commercial system before accounting for warranty disputes, unplanned repairs, and client attrition.
This guide delivers 10 advanced, actionable structures that distinguish high-performing BIPV portfolios from underperforming ones. Each structure is mapped to specific client segments — because what matters most to an EPC managing performance guarantees is different from what an architect needs to specify a maintainable system.
1. Implement Real-Time, Granular Monitoring with AI-Driven Analytics
Why String-Level Monitoring Is No Longer Enough
Traditional SCADA systems for solar assets typically aggregate data at the string or inverter level. That resolution is sufficient for utility-scale ground-mount arrays where modules are uniform, unshaded, and easily accessible. For BIPV curtain wall and roofing systems — where individual panels face different orientations, receive varying irradiance by floor zone, and are embedded in the building structure — string-level monitoring is too coarse to catch the failures that matter most.
A single failing bypass diode in one module of a 20-module string reduces that string’s output by approximately 5%. At string-level monitoring, a 5% drop against modeled P50 production in a shading-affected facade can be attributed to cloud cover for weeks before anyone investigates. Module-level monitoring flags the specific panel, the specific floor level, and the pattern of decline within hours.
Module-Level Power Electronics (MLPE): The Monitoring Foundation
MLPE (Module-Level Power Electronics): Microinverters or DC power optimizers installed at each individual BIPV panel, enabling independent maximum power point tracking per module and providing individual performance data to the monitoring platform.
Deploying MLPE adds $0.10–$0.25 per watt to system cost. On a 300 kW commercial BIPV facade, that is $30,000–$75,000. Against the yield improvement from eliminating string-mismatch losses in a shading-affected facade (typically 5–15% annual yield recovery), the ROI is measured in 2–4 years — before accounting for the diagnostic value of module-level fault detection.
A 2024 MDPI study on MLPE in facade BIPV systems documented that power optimizers reduced mismatch losses by 18–32% on east- and west-facing facade zones with partial shading from adjacent parapets — loss categories that would have been invisible in string-level monitoring data.
AI-Powered Anomaly Detection: From Alerts to Diagnosis
The step change in monitoring value comes when AI-powered platforms move beyond alert thresholds to failure signature recognition — identifying not just that performance has dropped, but what is causing it, based on the temporal, thermal, and irradiance patterns of the deviation.
Three failure modes that AI distinguishes reliably where manual analysis cannot:
- Soiling accumulation: Output decline proportional across all modules in a zone, correlated with time since last rainfall — alerts to cleaning schedule, not hardware dispatch
- Cell microcrack: Output decline localized to one or two modules, temperature-correlated (cracks expand thermally), stable over time — alerts to module replacement planning
- Bypass diode failure: Output decline in exactly one-third of a module’s cells, stable with irradiance, not temperature-correlated — alerts to immediate electrical inspection
Research published in Nature Scientific Reports (2026) demonstrated AI fault detection frameworks achieving 98.95% accuracy in real-time classification of PV system faults — a precision level that eliminates the false-alarm rate that causes facilities managers to start ignoring alert notifications.
Value for EPCs and Contractors: Reduces reactive maintenance calls by 60–80%, improves SLA compliance on performance guarantee contracts, and provides data-backed documentation for warranty claims.
| Monitoring Level | Data Resolution | Fault Detection Speed | Cost Premium | Recommended For |
|---|---|---|---|---|
| Inverter-level | System total | Days to weeks | None | Simple rooftop arrays without shade variability |
| String-level SCADA | Per string | Hours to days | Low ($0.01–0.03/W) | Uniform, unshaded BIPV arrays |
| MLPE + cloud platform | Per module | Minutes to hours | Medium ($0.10–0.25/W) | Complex facades with shading variability |
| AI anomaly detection | Per module + pattern | Real-time | High ($0.05–0.10/W) | Portfolios with performance guarantee contracts |
2. Integrate BIPV Monitoring into Building Management Systems (BMS)
The Missed Opportunity in Siloed Energy Data
Most commercial buildings with BIPV systems operate two parallel energy data streams: the BIPV monitoring platform showing generation, and the BMS showing consumption by system. These data streams sit in separate interfaces, accessed by different people, analyzed independently — which means the most valuable insight is never captured: the real-time relationship between what the facade is generating and what the building is consuming.
When a BIPV system generating 120 kW at noon coincides with an HVAC demand peak of 380 kW, the building is self-supplying 32% of its peak load. If that relationship is measured, it informs tariff structures, demand response strategies, and LEED energy modeling. If it is not measured, it is invisible value.
BMS (Building Management System): An automated platform that monitors and controls a building’s energy-consuming systems — HVAC, lighting, lifts, plug loads — in real time. Integration with BIPV monitoring via Modbus TCP, BACnet/IP, or REST API enables unified energy dashboards.
Integration Architecture That Works in Practice
The practical integration between a BIPV monitoring platform and an existing BMS requires three confirmed decisions before installation:
Communication protocol: Modbus TCP/IP is the universal fallback — supported by all major inverter manufacturers and all major BMS platforms. BACnet/IP offers richer device discovery and is preferred in facilities with sophisticated BMS deployments. MQTT over cloud connectivity suits projects using cloud-based energy management platforms that serve both the BMS and BIPV monitoring functions.
Data point mapping: Decide which BIPV data points appear on the BMS energy dashboard. At minimum: total instantaneous generation (kW), cumulative generation (kWh today, this month, this year), and a system status flag (Normal / Alert / Fault). Optional: string-level generation, inverter temperature, and specific yield versus modeled output.
Alert routing: BIPV performance alerts should route to the building’s facilities management team via the BMS, not solely to the BIPV O&M provider. Facility managers who see BIPV performance on the same screen as HVAC status and lighting loads develop the operational context to catch anomalies that would otherwise wait for the monthly O&M report.
Value for Architects and Consultants: BIPV output integrated into the BMS energy model improves the accuracy of LEED v4.1 Energy & Atmosphere performance reporting, BREEAM Ene 04 credit documentation, and WELL v2 Light Concept submissions. Automated reporting directly from the BMS reduces the manual data collection burden that often delays certification renewals.
3. Conduct Predictive Maintenance Based on Environmental Exposure Data

Thermographic inspection during a scheduled O&M visit — the difference between predictive maintenance and a warranty dispute.
Moving From Calendar-Based to Data-Driven O&M
Fixed-interval maintenance schedules — quarterly cleaning, annual electrical inspection — are designed for the average project in the average climate. For a BIPV curtain wall on a Dubai commercial tower facing prevailing sandstorm winds, “annual cleaning” is a performance guarantee violation. For an office building in Reykjavik with consistent rainfall, quarterly cleaning is unnecessary cost.
Soiling rate — the speed at which dust, pollen, pollution particulates, and bird deposits accumulate on the glass surface — varies by a factor of 5–10× across climate zones and urban environments. IEA PVPS Task 13 research on IR and EL imaging for PV field applications documents soiling-driven yield losses of 5–15% annually in urban and arid environments — the full range of which is only predictable with environmental monitoring data.
Environmental Sensor Integration
Deploy two sensor types that enable data-driven maintenance scheduling:
Pyranometers (solar irradiance sensors) mounted on the facade at representative zones enable real-time calculation of actual performance ratio. When measured PR drops below the clean-state baseline by more than 3%, the system flags a cleaning recommendation — regardless of whether the fixed calendar interval has been reached.
Particle counters or soiling sensors measure the accumulation of airborne particles on a reference surface adjacent to the BIPV array. Soiling sensors calibrated to the local dust composition provide 7–14 day advance notice of cleaning needs — allowing scheduled cleaning dispatch rather than emergency response to a performance alert.
For roofing and curtain wall contractors maintaining BIPV systems in coastal zones: salt crystallization on glass surfaces creates cleaning urgency that soiling sensors do not capture. Schedule dedicated coastal maintenance inspections within 72 hours of any storm event involving onshore wind above 25 knots, regardless of the monitored soiling rate.
Value for Roofing and Curtain Wall Contractors: Data-driven maintenance scheduling reduces unnecessary cleaning visits by 20–35% in low-soiling environments and prevents the 5–15% annual yield loss from under-cleaning in high-soiling environments. Both outcomes improve contract profitability on performance-based O&M agreements.
4. Optimize System Design for Partial Shading and Thermal Gradients
The Non-Linear Cost of Ignoring Shade
Partial shading is the most reliably underestimated performance risk in BIPV facade design. The non-linearity of the problem is what makes it dangerous: a shadow that covers 10% of a cell can reduce the output of an entire series-connected string by 30–50%, because current in a series string is limited by the weakest cell.
For curtain wall BIPV systems on urban buildings, sources of partial shading are structural features of the building itself: parapets, overhangs, balcony edges, HVAC housings, and adjacent buildings. These are predictable — every one of them can be modeled in 3D before a single module is specified.
Conducting a comprehensive shading analysis using PVsyst’s 3D scene builder or Helioscope before finalizing the string architecture is not an optional design nicety. On a 500 kW BIPV facade with 15% average shading loss that was not modeled — and therefore not mitigated in the string design — the annual yield shortfall is approximately 75,000 kWh. At $0.15/kWh, that is $11,250 per year, compounding for 25 years.
Stringing Strategies That Protect Facade Yield
Three stringing approaches address different shading scenarios on BIPV facades:
Shade-matching string architecture: Group modules in series strings that share the same orientation and shading profile. Modules on the south face of a floor that receives morning shade from a parapet should not be in the same string as modules in the unshaded center zone. This requires coordination between the energy modeler and the electrical engineer at design development — not at shop drawing review.
Bypass diode configuration: Standard PV modules include bypass diodes across groups of cells (typically 18–24 cells per diode group). In facade BIPV, where shading patterns are often linear (horizontal shadow from a floor slab overhang), bypass diode placement should be specified to align with the expected shadow geometry. A module with bypass diodes protecting horizontal cell rows responds differently to a horizontal shadow than one with diodes protecting vertical rows — and the difference can be 15–25% of the shaded-state output. PVsyst’s bypass diode analysis documentation provides the technical basis for this specification decision.
MLPE for complex shading: Where the facade geometry makes shade-matching impractical — irregular building forms, facades with multiple orientations, or buildings with complex neighboring obstructions — MLPE eliminates the series string constraint entirely. Each module operates at its individual maximum power point. The cost premium ($0.10–$0.25/W) is justified when shade-related mismatch loss in a conventional string system would exceed 10% of annual yield.
Value for Design Institutes: Delivering higher-than-modeled yield at Year 1 commissioning is the most powerful evidence that a firm’s BIPV design methodology is sound. It creates the trust that drives repeat specifications on future projects.
5. Leverage Digital Twins for Performance Forecasting and Retrofit Planning
What a BIPV Digital Twin Actually Does
Digital Twin: A continuously updated virtual model of a physical system — in this context, a BIPV facade or rooftop installation — that is synchronized with real operating data and can be used to simulate future conditions, test hypothetical scenarios, and support maintenance decisions without physical intervention.
A 2024 ScienceDirect review of BIM-to-digital-twin integration in BIPV found that digital twin platforms enabled simulation of 25-year performance trajectories with degradation modeling, climate data integration, and retrofit scenario analysis — providing building owners with the equivalent of an actuarial table for their energy asset.
For EPC firms and energy service providers, the commercial value of offering digital twin-based lifecycle management is substantial: it transforms a one-time installation contract into a 25-year advisory relationship. The firm that holds the digital twin holds the institutional knowledge about the system that no competitor can easily replicate.
Practical Applications of the BIPV Digital Twin
Degradation simulation: Input the manufacturer’s certified degradation rate (typically 0.4–0.5%/year for quality BIPV glass from manufacturers like Jia Mao BIPV) and the digital twin generates a year-by-year yield forecast that updates automatically as real performance data is received. When actual degradation exceeds the modeled rate — signaling accelerated aging from an environmental or installation factor — the digital twin flags it and models the impact on the remaining energy value.
Retrofit planning without physical disruption: Before recommending an inverter replacement or a partial module upgrade to a building owner, test the scenario in the digital twin first. Model the yield improvement from replacing 15-year-old string inverters with modern units featuring lower minimum input voltage. Calculate the payback. Present data, not estimates — and do so without sending a crew to site.
As-built documentation integration: The digital twin serves as the living as-built record of the system — module serial numbers, string assignments, electrical test results, and maintenance history stored in a single model referenced against the physical layout. When a module is replaced, the twin is updated. When a performance alert is triggered, the twin shows the historical context that determines whether it is a new problem or a developing trend.
Value for EPCs and Energy Service Providers: Digital twin-based lifecycle management enables performance assurance contracts that are priced at a premium to conventional O&M because they deliver a fundamentally different level of service visibility.
6. Standardize O&M Protocols Across Multi-Site BIPV Portfolios
Watch: BIPV Engineering Principles — Structural and Electrical Safety for Curtain Wall Systems
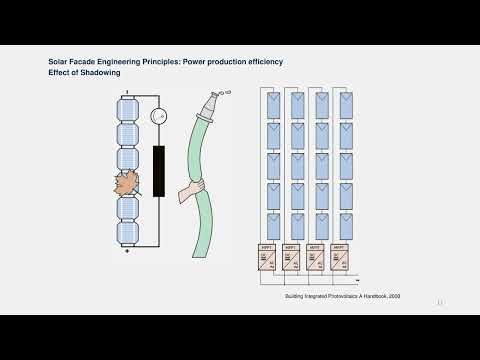 This video covers the engineering fundamentals of BIPV curtain wall integration — essential context for O&M teams managing facade-integrated photovoltaic systems.
The Portfolio Management Challenge
An EPC firm or roofing contractor managing BIPV systems across 15 commercial buildings faces a specific operational problem: inconsistent site conditions, different product generations, varying monitoring platforms, and field technicians with different levels of BIPV-specific training. Without standardized protocols, O&M quality varies by site, by technician, and by whoever happens to be on shift when an alert fires.
Standardized O&M protocols solve this by creating a consistent, replicable service delivery framework that is independent of individual technician knowledge.
Core Protocol Elements for Multi-Site BIPV Portfolios
Infrared (IR) Thermography: Deploy thermal imaging on all commercial BIPV installations annually, conducted from a drone platform for facades and skylights where ground-level or BMU access is impractical. Capture thermal images across the full array under irradiance above 600 W/m² (low-irradiance images do not produce meaningful thermal differentials). Flag any module hotspot exceeding the mean array temperature by more than 10°C for immediate IV curve investigation.
Electroluminescence (EL) Imaging: Conduct EL testing every 3–5 years on facade-integrated systems, or after any reported impact event or extreme weather. EL imaging — performed at night by passing a forward current through the module and photographing the emitted light — reveals cell microcracks, delamination, and connection failures that are invisible to IR thermography. The IEA PVPS review on IR and EL imaging classifies defects by severity and recommended response — use this classification system to standardize how your technicians document and escalate EL findings.
Adhesion Testing for Frameless BIPV: For structural bonded or frameless BIPV installations, include adhesion pull-off testing of the bonding interface at 5-year intervals. Use a calibrated pull-off adhesion tester on a 1-in-20 sample of bonding points. Minimum acceptable adhesion: 1.0 MPa (145 psi) — below this threshold, the bonding line requires investigation and possible reapplication.
Unified O&M Report Template: Every site visit generates a digital report with identical structure across all portfolio sites — inspection date, technician certification reference, findings by zone, photographic evidence, performance metrics against modeled P50, corrective actions taken and deferred, and next scheduled visit date. This uniformity makes portfolio-level performance comparison possible and provides the audit trail that client ESG reporting departments require.
Value for Building Material Distributors: A distributor that stocks critical spare modules (matching the current production specification with documented batch color consistency), compatible sealant products on the manufacturer’s approved list, and updated technical bulletins from the manufacturer becomes the supply chain backbone that O&M providers depend on. That dependency is a relationship, not a transaction.
7. Enhance Aesthetic-Performance Balance Through Custom Module Engineering

The Efficiency Trade-Off Is Smaller Than You Think
The standard objection to custom-colored or high-transparency BIPV glass is the efficiency reduction: “if we use a 30% VLT product instead of opaque, we’re losing output.” This is true but often overstated in project conversations.
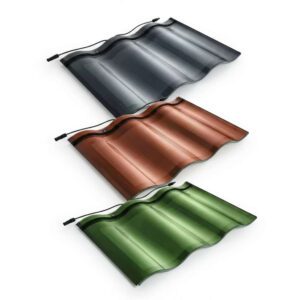
The IEA PVPS Technical Guidebook documents that colored BIPV modules reduce efficiency by 4–15% compared to standard anthracite-colored modules, depending on the specific color chosen. A green-tinted module loses approximately 4%. A terracotta module loses approximately 15%. These are meaningful differences — but the absolute output from a facade surface that previously generated nothing is still positive regardless.
The correct question is not “how much efficiency does the color cost?” — it is “what is the net output of the facade zone in its designed configuration, and does it meet the project’s energy target?” That question requires facade-specific irradiance modeling, not a blanket efficiency comparison.
Spectrally Selective Coatings: Performance Without Transparency Compromise
Spectrally selective coatings are thin-film layers deposited on the glass surface that selectively transmit visible light (for daylighting) while absorbing or reflecting near-infrared radiation (for power generation or heat management). When applied to BIPV glass, they allow higher visible light transmittance (VLT) — more daylight into the building — without proportionally reducing power output.
For architects specifying BIPV glass in vision zones where daylighting quality matters, a product with spectrally selective coatings can achieve 40–50% VLT (equivalent to standard solar-control architectural glass) while maintaining 70–80% of the power output of an equivalent opaque configuration. This is the specification that makes the energy-versus-daylighting trade-off genuinely negotiable rather than a binary choice.
Color batch management is the supply chain detail that determines facade appearance quality across large installations. Modules from different production batches vary slightly in tint — a difference invisible when holding two panels side by side, but visible at facade scale when alternating panels from different batches are installed in adjacent positions. Specify modules from a single production batch for each facade elevation. For large projects where a single batch is insufficient, specify the maximum allowable colorimetric tolerance (ΔE < 2.0, measured to ISO 11664-6) in the supply contract.
Value for Architects and Designers: BIPV glass that achieves design intent — the right color, the right transparency, the right pattern — while meeting energy performance targets is what allows BIPV to enter the specification rather than be value-engineered out. Custom module engineering is the bridge between design ambition and energy compliance.
8. Maximize Financial Returns via Dynamic Energy Storage and Grid Services
Beyond Self-Consumption: The Grid Services Revenue Layer
A BIPV system that generates 500,000 kWh per year and exports the majority during low-tariff midday hours captures only a fraction of its potential financial value. The combination of BIPV with battery energy storage and demand response capability unlocks three additional revenue mechanisms that transform the project economics.
Time-of-Use (TOU) Arbitrage: Store BIPV-generated electricity during low-tariff daytime periods and discharge during high-tariff evening peaks. In California’s commercial TOU tariff structure, the peak-to-off-peak price ratio is approximately 3:1 ($0.37/kWh peak versus $0.12/kWh off-peak on PG&E’s E-19 rate). A BIPV + BESS system capturing this differential on 200 MWh annually adds $50,000/year in value above simple self-consumption — from the same generation, the same building, the same facade.
Peak Shaving: Reducing the peak demand charge on the monthly utility bill by deploying battery storage to smooth the demand curve. Commercial peak demand charges of $15–$25/kW-month represent 30–50% of the total electricity bill for many commercial tenants. A BIPV + BESS system sized to reduce peak demand by 50 kW saves $9,000–$15,000 per month on a site with a $15–$25/kW-month demand charge — a figure that changes the payback analysis fundamentally.
Virtual Power Plant (VPP) Participation: Aggregating BIPV + BESS capacity across a portfolio of buildings into a VPP that bids into grid ancillary services markets — frequency regulation, capacity reserves — generates revenue streams that are entirely disconnected from the building’s own energy consumption. VPP programs in California (CAISO), Australia (AEMO), and several European markets are now accessible to commercial building portfolios with as little as 500 kW of aggregate dispatchable capacity.
For energy service providers: the building owner who understands that their BIPV facade is a participant in the electricity market — not just a self-consumption device — has a fundamentally different relationship with the asset. They become energy asset investors, not just building owners. The EPC or energy service firm that positions itself as the manager of that investment commands a different type of contract relationship.
9. Future-Proof BIPV Installations with Modular and Upgradable Components
The Technology Curve That Changes the Calculus
Perovskite-silicon tandem cells have reached certified laboratory efficiencies of 33%+ and are approaching commercial production readiness for building-integrated applications in the 2027–2028 timeframe. When these cells enter the BIPV glass market at commercial scale, semi-transparent facade modules will generate 2–3× more electricity per square meter than current amorphous silicon products — at similar or lower transparency levels.
For a building owner whose BIPV facade was installed in 2025, the question in 2030 will be: can the higher-efficiency modules be retrofitted into the existing curtain wall system, or does upgrading require a full facade replacement?
The answer depends entirely on decisions made during the original installation.
Design-for-Upgrade: The Decisions That Cost Almost Nothing Now
Inverter room spare capacity: Size the inverter room and DC collection infrastructure for 120–130% of the current installed capacity. The incremental cost of additional conduit runs, larger combiner boxes, and oversized breaker panels during initial installation is typically 3–8% of the electrical system cost. The cost of adding this capacity as a retrofit — with occupied building access, finished ceiling demolition, and fire-stop reinstatement — is 5–10× higher.
Modular inverter architecture: Specify string inverters or modular central inverter platforms where individual inverter units can be removed and replaced without shutting down the entire array. Platforms like SMA’s Sunny Central Storage series and Huawei’s modular SUN2000 architecture allow capacity addition and inverter replacement with minimal system downtime.
IEEE 1547-2018 compliance: All inverters specified today should comply with IEEE 1547-2018 — the U.S. standard governing interconnection of distributed energy resources to the grid. IEEE 1547-2018 includes smart grid communication capabilities (Volt-VAR response, frequency-watt response, reactive power control) that enable BIPV systems to participate in advanced grid services programs that are currently being deployed but not yet universally required. Specifying compliant inverters now avoids forced replacement when these capabilities become mandatory in 5–10 years.
Design for disassembly: Unitized curtain wall systems allow individual BIPV panel replacement without scaffold mobilization for the full facade. For rooftop BIPV, mechanically fastened systems allow panel-by-panel replacement without disturbing the waterproofing membrane. The additional cost of designing for component-level replaceability is typically 5–10% of the installation cost — recoverable in the first replacement event.
Value for General Contractors: Contractors who specify upgrade-ready systems today are the ones winning O&M contracts at Year 10 when the next technology generation arrives. The building owner who can upgrade without a full facade replacement stays with the contractor who designed the upgrade path into the original system.
10. Establish Performance Benchmarking and Client Reporting Dashboards
The KPIs That Move Conversations From Costs to Assets
Building owners and property investors increasingly evaluate BIPV assets using the same financial and performance metrics they apply to any other revenue-generating asset. The contractors, EPCs, and energy service providers who speak this language — fluently, with data — are the ones who retain clients for the full 25-year lifecycle.
Three performance metrics form the core of any BIPV client reporting dashboard:
Performance Ratio (PR): Actual energy output divided by the theoretically expected output under measured irradiance conditions. PR = 0.78 means the system is delivering 78% of its theoretical maximum, accounting for real-world losses. A declining PR trend over time identifies degradation, soiling, or equipment failures. Industry benchmark: PR ≥ 0.75 at commissioning, ≥ 0.72 at Year 10 for a well-maintained system.
Specific Yield (Yf): Annual kilowatt-hours generated per installed kilowatt-peak. Yf allows comparison of systems with different installed capacities. For south-facing commercial BIPV facades in Central Europe: Yf of 700–900 kWh/kWp/year is typical. For Southeast Asian markets: 1,100–1,400 kWh/kWp/year. Comparing a project’s Yf against the climate-normalized benchmark identifies whether underperformance is a system issue or a climate anomaly.
Levelized Cost of Output (LCOC): Total lifecycle cost divided by total lifecycle energy output — expressed in $/kWh. LCOC allows direct comparison of BIPV against the current and projected utility tariff, establishing the “breakeven tariff” at which the BIPV system becomes economically competitive. As utility tariffs escalate at 2–3% annually, LCOC comparisons become increasingly favorable over time.
Reporting Dashboards That Support ESG Disclosure
The fastest-growing driver of BIPV client reporting demand is not energy management — it is ESG (Environmental, Social, and Governance) disclosure. Building owners with institutional investors, corporate tenants, or publicly listed equity are required to report operational carbon intensity, on-site renewable generation, and energy performance ratings in their annual sustainability reports.
A BIPV monitoring platform that automatically generates the data tables, charts, and narrative summaries required for GRI 302 (Energy) and GRI 305 (Emissions) disclosures transforms a building owner’s quarterly reporting from a manual data-collection exercise into an automated download. EPCs and O&M providers who offer this capability as part of their service package are delivering something that building owners cannot easily replicate in-house — which is the definition of a durable service relationship.
For green financing: lenders issuing green bonds, sustainability-linked loans, and C-PACE financing for BIPV projects require annual performance verification. A client reporting dashboard that produces an automatically formatted performance certificate — actual yield versus guaranteed yield, PR versus target, carbon avoided in tonnes — satisfies that verification requirement without additional engineering effort. Jia Mao BIPV’s technical resources include certification and performance documentation guidance for projects requiring third-party verification.
BIPV System Performance Benchmarks by Application Type
| BIPV Application | Typical Annual Yield | Target PR | Key O&M Risk | Monitoring Priority |
|---|---|---|---|---|
| South-facing curtain wall (temperate) | 700–900 kWh/kWp/yr | ≥0.76 | Partial shading from adjacent structures | Module-level (MLPE required) |
| East/West-facing curtain wall | 450–650 kWh/kWp/yr | ≥0.73 | TOU mismatch (peak generation off-peak hours) | String-level + battery SOC |
| Rooftop BIPV tiles (30° tilt south) | 900–1,200 kWh/kWp/yr | ≥0.78 | Soiling (dust, moss, bird deposits) | String-level with IR scheduling |
| Horizontal skylight / overhead glazing | 750–950 kWh/kWp/yr | ≥0.75 | Soiling (self-cleaning less effective) | Module-level + cleaning alerts |
| Spandrel / opaque cladding | 800–1,100 kWh/kWp/yr | ≥0.77 | Thermal stress at non-ventilated installation | IR thermography priority |
| Canopy / carport | 950–1,250 kWh/kWp/yr | ≥0.79 | Wind vibration at mounting connections | Structural + electrical combined |
Sources: IEA PVPS Technical Guidebook (2025); Jia Mao BIPV field performance data; ScienceDirect BIPV performance studies 2024–2026.
Questions fréquemment posées
1. How can BIPV systems be monitored effectively across multiple building sites?
Deploy a centralized cloud monitoring platform — SolarEdge, Enphase Enlighten, or SMA Sunny Portal for branded equipment; custom SCADA with Modbus/BACnet integration for mixed-equipment portfolios — with REST API connections into each site’s BMS. Configure portfolio-level dashboards showing aggregate generation, site-by-site PR comparison, and flagged anomalies by severity. For firms managing 10+ BIPV sites, the operational standard is a single screen that shows all sites’ real-time status with exception-based alerting — not 10 separate logins. The Solar Best Practices monitoring standards provide a useful baseline for data point requirements across commercial BIPV portfolios.
2. What are the most common causes of BIPV underperformance in curtain wall installations?
Three causes account for approximately 80% of underperformance in curtain wall BIPV: first, shade mismatch in string architecture — shaded modules in the same string as unshaded modules causing disproportionate output loss (preventable with shade analysis at design stage); second, soiling accumulation on vertical glass surfaces that self-clean less effectively than tilted panels (mitigated with predictive cleaning schedules based on irradiance-normalized PR monitoring); third, inadequate rear ventilation causing elevated module temperatures — every 1°C above STC reduces crystalline silicon output by approximately 0.35–0.40%. Confirm minimum 20–30 mm rear ventilation gap in curtain wall cavity design.
3. How do I ensure BIPV compliance with local building and fire codes?
Partner with manufacturers who provide assembly-specific third-party test certifications — not just product-level certifications. For U.S. buildings above 40 feet, submit the NFPA 285 test report for the specific wall assembly configuration being installed (same insulation, same cavity depth, same framing type as the tested assembly). For electrical compliance, use only UL-listed components in configurations that have been evaluated as a system. Contact UL’s BIPV testing and certification services for assembly-specific compliance pathways on complex facade configurations.
4. Can BIPV replace traditional cladding without compromising structural integrity?
Yes, when engineered correctly. BIPV glass panels weigh 20–25 kg/m² (glass-glass crystalline) or 15–20 kg/m² (thin-film). These loads must be verified against the curtain wall frame capacity and the building anchor system by a licensed structural engineer. For retrofit applications replacing existing cladding, PE-stamped structural verification of the existing system’s capacity for the new dead load is required before ordering. Wind uplift ratings up to 4.0 kPa — sufficient for most high-rise commercial applications — are available from manufacturers including Jia Mao BIPV, with project-specific structural calculations provided on request.
5. What maintenance schedule is recommended for rooftop BIPV systems?
The data-driven standard: quarterly soiling-rate assessment via irradiance-normalized PR monitoring, cleaning when PR drops 3% below the clean-state baseline (not on a fixed calendar), annual IR thermography and electrical inspection (IV curve, insulation resistance, grounding continuity), and EL imaging every 3–5 years or after impact events. For coastal installations, add a post-storm inspection after any weather event with onshore winds above 25 knots. Document every maintenance activity in a digital log with timestamped photos and test results — this is the evidence set that defends warranty claims.
6. How can architects specify BIPV without delaying design timelines?
Use pre-certified BIPV product families — manufacturers like Jia Mao BIPV provide Revit component families, structural load data sheets, fire test documentation packages, and energy performance data in BIM-compatible formats — that can be incorporated into design development without waiting for custom engineering deliverables. Engage the BIPV manufacturer’s technical team at schematic design, not construction documents. The coordination that happens at 30% design takes 2–4 days; the same coordination at 90% design takes 3–6 weeks and often requires redesign.
7. What ROI can building owners expect from commercial BIPV integration?
Typical commercial BIPV facade IRR ranges from 7–12% over 20 years depending on local electricity tariff, available incentives, facade orientation, and baseline glazing cost being replaced. With the U.S. 30% ITC applied, Year 1 effective project cost drops by approximately 30–50% when MACRS depreciation is also included. For building owners in high-tariff markets (California, Northeast U.S., Western Europe) with south-facing facades exceeding 1,000 m², IRR above 10% is achievable even without state-level incentive stacking. Consult the DSIRE database for current state-level incentive availability.
8. How do BIPV systems perform in low-light or diffuse-light conditions?
Modern monocrystalline BIPV modules maintain 70–80% of their STC output under diffuse irradiance conditions — overcast skies, early morning, and late afternoon. Amorphous silicon thin-film BIPV performs proportionally better in diffuse conditions (temperature coefficient of -0.19%/°C versus -0.37–0.40%/°C for crystalline silicon). For northern European and Pacific Northwest climates where diffuse irradiance represents 40–60% of annual total, thin-film BIPV products consistently deliver higher real-world annual yield relative to their STC rating than crystalline alternatives. The Powerhouse Brattørkaia in Trondheim (63°N) generates over 500,000 kWh/year — exceeding the building’s total consumption — as evidence that high-latitude BIPV with correct product selection and orientation design delivers commercially viable yields.
9. Can BIPV be integrated with energy storage for off-grid or resilience applications?
Yes. DC-coupled BIPV + BESS systems — where the battery charges directly from the BIPV array’s DC output before inversion — eliminate one AC/DC conversion cycle, improving round-trip efficiency by 3–7% compared to AC-coupled systems. For resilience applications (hospitals, data centers, emergency response facilities), size the BESS for the critical load duration required (minimum 4 hours of critical-load operation is the NHS and FEMA benchmark). IEEE 1547-2018 compliance in the inverter system enables island-mode operation during grid outages. Coordinate the anti-islanding protection configuration with the local utility before commissioning.
10. What are the best practices for grounding and lightning protection in BIPV facades?
Follow IEC 62305 for lightning protection system design — the standard applies to the complete building structure and the BIPV array as a connected system. Use continuous copper or aluminum bonding conductors connecting all BIPV module frames to the building’s main lightning protection network. For high-rise facades, the BIPV array effectively functions as an air terminal in the building’s lightning protection zone — coordinate this with the lightning protection engineer at design stage, not at inspection. Verify grounding continuity from the last module frame to the grounding electrode with a low-resistance ohmmeter at commissioning; target resistance <0.5 Ω for the complete equipment bonding path.
From Installation to Lifecycle Leadership
The BIPV market is not waiting for the industry to catch up. Global capacity installations are accelerating. Regulatory mandates in the EU, California, Singapore, and an expanding list of markets are making on-site renewable generation a compliance requirement rather than a premium option. The professionals who move now — building monitoring capability, predictive maintenance workflows, digital twin competency, and financial modeling fluency — are compounding advantages that become increasingly difficult for late entrants to replicate.
The 10 structures in this guide are not theoretical frameworks. Each one addresses a specific pain point that EPC firms, curtain wall contractors, architects, and building material partners encounter on real projects: the performance shortfall nobody caught until Year 3, the warranty claim that collapsed because maintenance records were incomplete, the facade that underperformed by 18% because the shading analysis was done on a clear-sky day, the client who switched to a competitor because the O&M reporting was a PDF attached to an email.
The BIPV system that delivers superior value at Year 25 looks exactly like it did at Year 1 — and the building owner knows it, because the data has been on their dashboard every month since commissioning.
Three actions to implement before your next project handover:
First, configure module-level monitoring with AI anomaly detection before the system goes live. The monitoring infrastructure installed at commissioning is 60–70% cheaper than retrofitting it at Year 3 when the first performance dispute arises.
Second, establish a digital twin with the as-built system data at handover — not as an aspiration for the next project. The data required to build it exists at commissioning; the effort to capture it drops to near-zero when it is built into the handover workflow.
Third, connect with a BIPV manufacturer who provides lifecycle technical support — not just a product warranty. Jia Mao BIPV’s technical team supports commercial projects through specification, commissioning, and long-term O&M with documentation packages that satisfy LEED, ESG reporting, and third-party commissioning requirements. Start that conversation at the design stage of your next project, not at the warranty claim stage.
Glossary of Key Terms
BIPV (Building-Integrated Photovoltaics): Solar PV products that replace conventional building envelope materials — glazing, cladding, roofing — while generating electricity. Distinguished from BAPV (Building-Applied PV), which is rack-mounted on top of a completed building.
MLPE (Module-Level Power Electronics): Microinverters or DC power optimizers at each individual PV module, enabling independent maximum power point tracking and module-level performance monitoring.
Performance Ratio (PR): Actual measured energy output divided by theoretically expected output under measured irradiance. Target: ≥0.75 at commissioning; declining PR over time signals degradation or system faults.
Specific Yield (Yf): Annual kWh generated per installed kWp. Enables size-normalized performance comparison across projects and locations.
LCOC (Levelized Cost of Output): Total lifecycle project cost divided by total lifecycle energy output, expressed in $/kWh. Used to compare BIPV economics against current and projected utility tariffs.
Digital Twin: A continuously updated virtual model of a physical system, synchronized with real operating data, used for performance simulation, degradation forecasting, and retrofit planning.
TOU Arbitrage: Revenue strategy using battery storage to store low-tariff electricity and discharge during high-tariff peak periods, capturing the tariff differential as financial value.
VPP (Virtual Power Plant): An aggregation of distributed energy resources — BIPV systems, batteries, controllable loads — operated as a single dispatchable asset in electricity markets.
EL Imaging (Electroluminescence): A quality diagnostic technique that passes forward current through a PV module and photographs the emitted light pattern, revealing microcracks, delamination, and cell failures invisible to visual or thermal inspection.
VLT (Visible Light Transmittance): The percentage of visible daylight transmitted through a glazing panel. Higher VLT = more daylight; lower VLT = higher power density per m².
IEEE 1547-2018: The U.S. standard governing interconnection of distributed energy resources — including BIPV — to the electric power system, including smart grid communication and advanced grid support functions.