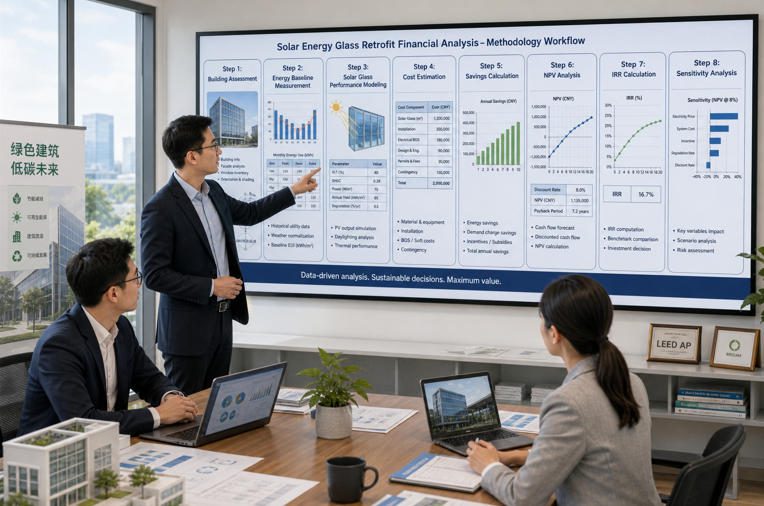
A step-by-step methodology for energy consultants, building engineers, and sustainability managers — grounded in peer-reviewed case studies, real measured data, and validated simulation tools.

1. Why Accurate Energy Savings Estimates Matter
Replacing conventional glazing with solar energy glass is one of the few building-envelope upgrades that simultaneously reduces cooling loads, generates on-site electricity, improves occupant daylighting comfort, and contributes to net-zero certification. Yet over-optimistic savings projections — or equally damaging, overly conservative ones — are the leading cause of BIPV retrofit projects stalling at board approval stage.
A 2024 peer-reviewed study in Energy and Buildings on transparent photovoltaic (TPV) glazing across six European climate zones found annual energy reductions ranging from 29.4% to 66.2%, depending on orientation, climate, and glazing specification. That 36-percentage-point spread illustrates precisely why generic “solar glass saves energy” statements are professionally inadequate. Every estimate must be anchored to a specific building, measured climate file, and verified product datasheet.
A 2025 Springer study on a UAE office building found that replacing conventional window glass with PV glass reduced the peak cooling load by approximately 30 kW — enough cooling reduction to be supplied by the PV plant itself, pointing toward a near-self-sufficient cooling scenario in hot climates. Without a methodology-grounded estimate, that opportunity goes unquantified and the project goes unfunded.
This guide walks through the complete estimation workflow — from establishing a defensible baseline through to Monte Carlo risk modelling — so you can present credible numbers, protect your professional reputation, and move projects from concept to construction. Product specifications cited throughout are drawn from Jia Mao BIPV transparent glass and from independently peer-reviewed case studies.
2. Solar Energy Glass — Product Fundamentals for Estimators
Before any calculation begins, the estimator must understand the two primary product configurations and their measurable performance parameters, because each interacts differently with a building’s thermal and electrical balance. Substituting one specification for another in a model can shift the projected NPV by €80–150/m², which is the difference between a fundable and an unfundable project.
2.1 Semi-Transparent Photovoltaic Glass
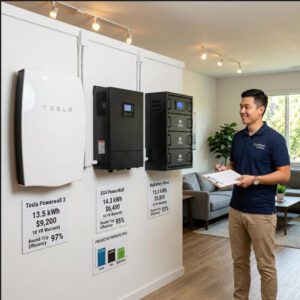
Semi-transparent BIPV glass uses strategically spaced monocrystalline silicon or thin-film cells embedded between two glass lites, maintaining visual transparency while generating electricity. Conversion efficiency for the transparent cell zone typically ranges from 2% to 12%, depending on cell density and technology. Jia Mao BIPV’s transparent glass panel — engineered for curtain-wall, skylight, and canopy applications — uses premium 182 mm × 182 mm monocrystalline cells with 22%+ individual cell efficiency deployed at four selectable active-area coverages (15%, 25%, 35%, or 50%), yielding system-level power outputs of 140 to 200 W/m² and annual energy yields of 180–250 kWh/m² in commercial building orientations. The SHGC range of 0.15–0.45 is the single most impactful parameter for cooling-load reduction calculations in hot and mixed climates.
2.2 Opaque BIPV Cladding
Opaque BIPV replaces conventional aluminum composite, terracotta, or stone cladding panels with high-density photovoltaic modules delivering up to 200 W/m² at zero VLT. While generating more electricity per unit area, these panels offer no daylighting benefit and are most appropriate for spandrel zones, podium facades, or north-facing walls where visual transparency is neither required nor desired. The financial case for opaque cladding is typically stronger, with payback periods 3–6 years shorter than semi-transparent variants due to lower incremental cost.

2.3 Key Parameters Every Estimator Must Document
The following table defines every parameter needed to populate a Tier 2–4 simulation model. All values must be sourced from the manufacturer’s IEC 61215-certified test report — not from marketing materials or product brochures, which may cite optimistic STC-only figures.
| Parameter | Typical Range | Jia Mao BIPV Spec. | Impact on Energy Model | Standard / Source |
|---|---|---|---|---|
| Visual Light Transmittance (VLT) | 10–90% | 30 / 50 / 70 / 90% | Daylighting savings; glare control | NFRC 200 / EN 410 |
| Solar Heat Gain Coefficient (SHGC) | 0.10–0.82 | 0.15–0.45 | Cooling & heating load ΔkWh | NFRC 200 / ISO 9050 |
| U-Value (overall, W/m²K) | 1.0–2.8 | Per IGU spec. | Heating load in cold climates | NFRC 100 / EN 673 |
| STC Power Density (W/m²) | 30–200 | 140–200 W/m² | Annual PV generation estimate | IEC 61215 |
| Cell/Module Efficiency (%) | 5–22% | ≥22% (cell level) | Scales directly with generation output | IEC 61215 |
| Temperature Coefficient (%/°C) | −0.19 to −0.40 | −0.29%/°C | Summer de-rating; hot-climate penalty | IEC 61215 / datasheet |
| Annual Energy Yield (kWh/m²) | 80–250 | 180–250 kWh/m² | Direct electricity generation offset | PVGIS / SAM simulation |
| Infrared Rejection (%) | 75–90% | 85% | Cooling load reduction in addition to SHGC | Manufacturer datasheet |
| UV Rejection (%) | 95–100% | 99% | Interior fade prevention; indirect comfort value | Manufacturer / ASTM D4329 |
| 25-yr Power Retention | 78–82% | ≥80% (linear warranty) | Degradation rate input to NPV model | IEC 61215 / warranty doc |
| Sources: NFRC, IEA-PVPS Technical Guidebook 2025, Jia Mao BIPV transparent glass datasheet, NREL SAM documentation, IEC 61215:2021. | ||||
Jia Mao BIPV Transparent Glass — Key Specifications for Energy Modellers
All parameters below are drawn from the IEC-certified product datasheet and are ready to input directly into EnergyPlus and NREL SAM simulations.
3. Establishing a Defensible Baseline — The Foundation of Every Estimate
Every credible savings estimate is the arithmetic difference between two scenarios: what the building consumes مع existing glazing, and what it would consume مع solar energy glass installed. Errors in the baseline propagate at a 1:1 ratio into claimed savings — a 10% error in baseline energy becomes a 10% error in projected savings. Industry standard practice, defined by ASHRAE Guideline 14, requires a minimum of 12 months of weather-normalized utility data; 24–36 months is preferred to average out weather anomalies and occupancy shifts.
3.1 Weather-Normalizing the Baseline Consumption
Raw utility bills conflate weather variation, occupancy changes, and operational decisions. Heating Degree Day (HDD) and Cooling Degree Day (CDD) normalization, or multivariate regression against outdoor air temperature, removes weather noise from the baseline. The NREL National Solar Radiation Database (NSRDB) provides Typical Meteorological Year (TMY3) files used to standardize climate inputs across all major simulation platforms. The output of this step is a baseline Energy Use Intensity (EUI) in kWh/m²/yr, which forms the reference point against which post-retrofit modelled EUI is compared.
3.2 Measuring Existing Glazing Properties
Do not assume existing glazing SHGC or U-value from visual inspection. A single-pane 1985 curtain wall and a double-pane 2010 Low-E unit may be visually indistinguishable from the interior but carry SHGC values of 0.82 and 0.27 respectively — a threefold difference that fundamentally changes the projected cooling-load reduction. Measurement options include handheld heat-flux meters (ISO 9869), portable solar spectrum analyzers, or review of the original glazing procurement records held by the building owner or facilities manager. Where records are unavailable, LBNL WINDOW software can back-calculate SHGC from measured center-of-glass U-values with reasonable accuracy.
3.3 Zoning the Facade by Orientation and Shading
A 5,000 m² commercial tower facade may include south-facing vision glass, north spandrel zones, east and west curtain wall sections, and partially shaded areas under architectural canopies. Each zone receives different annual irradiance, carries a different shading mask, and contributes differently to the building’s thermal load. Irradiance analysis using PVGIS (EU Joint Research Centre) or NSRDB, combined with 3D shading modelling in Rhinoceros/Ladybug or SketchUp/OpenStudio, partitions the facade into performance zones before modelling begins. The Helmholtz-Zentrum Berlin BIPV Living Lab study — a full 379 m² monitored facade — found south facade annual yield of 101.2 kWh/m², west facade 64.8 kWh/m², and north facade approximately 25 kWh/m²: a 4:1 ratio between best and worst orientation that would be completely obscured by whole-facade averaging.
4. The Four Estimation Methodologies — Matching Precision to Project Stage
No single estimation method suits every project stage or budget. A developer screening 200 buildings needs a 15-minute screen per site; a green-bond issuer certifying a $12 million facade retrofit needs a calibrated dynamic simulation with independent M&V. The four tiers below align with IEA PVPS Task 15 guidance and IPMVP Option D protocols. Using a higher tier than the project stage demands wastes time and fee; using a lower tier for a lender report or green bond submission destroys credibility.
Quick Top-Down Screen
Simplified formula using facade area, orientation, and climate zone. Execution time 2–4 hours per building. Appropriate for portfolio-level go/no-go decisions.
Accuracy: ±30–40%
Simplified Energy Balance
Zone-by-zone glazing analysis with monthly climate data and basic occupancy schedules. Tools: NREL SAM + ENERGY STAR regression. Appropriate for concept-stage feasibility.
Accuracy: ±20–25%
Dynamic Whole-Building Simulation
Full hourly simulation in EnergyPlus or DesignBuilder. Models HVAC response, occupancy schedules, daylighting dimming, and PV generation. Standard for LEED and lender reports.
Accuracy: ±10–15%
Calibrated M&V
Post-installation only. Calibrated model matched to 12 months of metered data per ASHRAE Guideline 14 (CV-RMSE ≤15% monthly). Required for performance contracts and green bond reporting.
Accuracy: ±5–8%
| Tier | Method | Accuracy | Time Required | Best Application | Primary Tool |
|---|---|---|---|---|---|
| 1 | Top-down screen | ±30–40% | 2–4 hrs | Portfolio screening, pre-feasibility | PVGIS + Excel |
| 2 | Simplified energy balance | ±20–25% | 1–3 days | Concept-stage feasibility report | NREL SAM + ENERGY STAR |
| 3 | Dynamic simulation | ±10–15% | 1–3 weeks | Design development, LEED, lender financing | EnergyPlus / DesignBuilder |
| 4 | Calibrated M&V | ±5–8% | Ongoing post-install | Performance contracts, green bond reporting | ASHRAE GL-14 protocol |
| Sources: IEA PVPS Task 15 Technical Report; ASHRAE Guideline 14 (2014, reaffirmed 2022); IPMVP 2023 Edition; IEA-PVPS BIPV Technical Guidebook 2025. | |||||
4.1 Tier 1 Core Formulas
TIER 1 — QUICK TOP-DOWN SCREEN
━━━━━━━━━━━━━━━━━━━━━━━━━━━━━━━━━━━━━━━━━━━━━━━━━
ANNUAL PV GENERATION:
E_gen (kWh/yr) = A × H_sol × η_module × PR
Where:
A = Active PV glass area (m²)
H_sol = Annual irradiation on facade orientation (kWh/m²/yr)
→ Source: PVGIS vertical-surface output or NSRDB TMY3
η_module = System-level module efficiency (decimal)
→ e.g., 0.12 for 50% VLT semi-transparent glass
PR = Performance ratio for facade installation
→ Use 0.72–0.80 (not the 0.78–0.85 used for rooftops)
━━━━━━━━━━━━━━━━━━━━━━━━━━━━━━━━━━━━━━━━━━━━━━━━━
ANNUAL COOLING LOAD REDUCTION:
ΔQ_cool (kWh/yr) = A × ΔSHGC × H_sol_cool × COP⁻¹
Where:
ΔSHGC = SHGC_existing − SHGC_BIPV
→ e.g., 0.70 − 0.25 = 0.45
H_sol_cool = Solar irradiation during cooling season (kWh/m²)
COP = Chiller coefficient of performance (typically 3.0–4.5)
━━━━━━━━━━━━━━━━━━━━━━━━━━━━━━━━━━━━━━━━━━━━━━━━━
5. Calculating the Three Savings Streams — Generation, Cooling, and Demand
A complete solar energy glass retrofit estimate separates savings into three distinct streams, each with its own calculation method, measurement point, and financial unit rate. Conflating them in a single “energy savings” figure leads to both methodological errors and professional embarrassment when actual metered results differ from projections. The three streams are direct electricity generation, cooling load reduction, and peak demand charge avoidance. A fourth minor stream — daylighting-driven lighting load reduction — is worth adding when a daylighting simulation (Radiance or EnergyPlus daylighting module) is available.
5.1 Stream 1 — Direct Electricity Generation
Using the Tier 1 formula with a 500 m² south-facing facade at 44° N latitude (northern Italy / central France), with annual vertical-plane irradiation of approximately 900 kWh/m²/yr sourced from PVGIS, and Jia Mao BIPV transparent glass at 50% VLT (system η ≈ 12%, PR = 0.76):
= 40,500 kWh/yr
At €0.28/kWh avoided cost:
Revenue = 40,500 × €0.28 = €11,340/yr
5.2 Stream 2 — Cooling Load Reduction
This is frequently the largest savings stream in hot and mixed climates, and the most commonly underestimated. The SHGC reduction from conventional clear glass (SHGC ≈ 0.70) to Jia Mao BIPV transparent glass (SHGC ≈ 0.25) reduces solar heat admission by 64%. For the same 500 m² south facade receiving 600 kWh/m² of solar irradiation during the cooling season:
= 500 × 0.45 × 600,000
= 135,000,000 Wh = 135,000 kWh of avoided heat gain
Cooling energy saved = 135,000 kWh ÷ COP (3.5)
= 38,571 kWh/yr
At €0.22/kWh commercial cooling rate:
Cooling saving = 38,571 × €0.22 = €8,486/yr
─────────────────────────────────────────
Supporting evidence:
• UC Davis BIPV IGU study: 16.8% total electricity reduction
when Low-E IGU replaced with BIPV IGU
• Springer / UAE study (2025): ~30 kW peak cooling reduction
from PV glass vs. conventional glazing
• ScienceDirect STPV study: 70% total heat gain reduction
at 80% active cell area coverage
─────────────────────────────────────────
5.3 Stream 3 — Peak Demand Charge Avoidance
For commercial buildings in jurisdictions with demand tariffs — common in the US ($10–25/kW·month), Australia (A$10–18/kW·month), and parts of Europe — reducing peak cooling load translates directly to lower monthly demand charges. This savings stream is entirely absent from projects in flat-tariff markets but can dominate the financial case in demand-tariff markets. For a 1,000 m² facade with the same SHGC change reducing peak cooling demand by 55 kW on a $18/kW·month tariff:
= $11,880/yr
Sensitivity: At $22/kW/month (US commercial high):
= 55 × $22 × 12 = $14,520/yr
5.4 Stream 4 — Daylighting Load Reduction (Optional but Valuable)
Semi-transparent BIPV glass at 50–70% VLT maintains adequate daylighting in perimeter zones, reducing artificial lighting energy. The Helmholtz-Zentrum Berlin study found that in February (lowest natural light month), the BIPV facade satisfied 51.3% of the building’s lighting load. A conservative estimate for a 500 m² glazed south facade improving daylighting in a 20 m deep perimeter zone might yield 8–15 kWh/m²/yr in lighting savings — approximately €2,500–4,500/yr depending on existing lamp types and control systems.
Note: Heating penalty applies in cold winters when reduced SHGC limits passive solar gain. Demand charge figures scaled from 1,000 m² to 500 m² equivalent.
Sources: ScienceDirect 2024; UC Davis BIPV IGU study; Springer UAE 2025; Jia Mao BIPV transparent glass datasheet; MDPI HZB Living Lab 2025.

6. Financial Analysis — NPV, IRR, and Payback Period
Once annual savings are estimated with appropriate methodology, the financial case is built around three metrics: simple payback period (for quick comprehension), net present value (NPV, for board approval), and internal rate of return (IRR, for comparison with alternative investments). For a BIPV facade project, the investment figure must represent the incremental cost — the cost of the BIPV system minus the cost of the conventional facade material it replaces — because the building would have required re-glazing regardless.
6.1 Incremental Cost Methodology — The Berlin Reference
The Helmholtz-Zentrum Berlin BIPV Living Lab study (MDPI, 2025) provides the most transparent and independently audited cost dataset available for a full-scale installed facade. The BIPV facade cost €621/m² for the PV-active zone, versus €320/m² for a conventional aluminum facade — an incremental cost of €301/m². With measured annual savings of €21.70/m² at a campus electricity tariff of €0.26/kWh, the simple payback is 14 years without inverter replacement, or 17 years including a year-10 inverter change-out.
6.2 NPV Calculation Framework
NPV FORMULA FOR BIPV GLASS RETROFIT
━━━━━━━━━━━━━━━━━━━━━━━━━━━━━━━━━━━━━━━━━━━━━━━━━
NPV = −C₀ + Σ [Sₜ / (1 + r)ᵗ] for t = 1 → n
Where:
C₀ = Incremental investment cost (BIPV − avoided conventional facade)
Sₜ = Net annual savings in year t:
Sₜ = (PV Generation + Cooling Saving + Demand Saving
+ Daylighting Saving − Heating Penalty − O&M)
× (1 − degradation)ᵗ × (1 + electricity escalation)ᵗ
r = Real discount rate (4–8% for commercial real estate)
n = System lifetime (25 years; bounded by power warranty)
IRR = r* such that NPV = 0
= Solve iteratively (Excel IRR function or financial calculator)
Simple Payback = C₀ ÷ S₁ (first-year net savings; ignores time value)
6.3 Full Scenario Comparison Table (Excel-Ready)
| Key Input Variable | Conservative | Central (Base Case) | Optimistic | NPV Impact on 500 m² Project |
|---|---|---|---|---|
| PV module degradation (%/yr) | 0.8% | 0.5% | 0.3% | ±€8,000–12,000 |
| Electricity price escalation (%/yr) | 1.5% | 2.5% | 4.0% | ±€40,000–60,000 |
| Occupant behavior factor | 0.75 | 1.00 | 1.15 | ±€24,000–40,000 |
| Cooling load reduction achieved | 12% | 20% | 30% | ±€20,000–35,000 |
| System lifetime (yr) | 20 | 25 | 30 | ±€30,000–50,000 |
| Discount rate (%) | 8% | 5% | 3% | ±€50,000–80,000 |
| Demand tariff structure | Flat rate only | Moderate demand charge | High demand charge | ±€0–72,000 |
| Simple Payback Period (yr) | 16–20 | 11–15 | 6–10 | — |
| 25-yr IRR | 3–5% | 6–9% | 10–14% | — |
| 25-yr NPV (500 m² project, €150k invest.) | −€40k to €0 | €80k–€160k | €200k–€350k | — |
| Sources: NREL U.S. Guidelines for Economic Analysis of BIPV; IEA-PVPS Technical Guidebook 2025; MDPI HZB Living Lab measured cost and savings data; SSRN BIPV facades cost-benefit comparison (SSC SSRN:4102745). | ||||
6.4 25-Year Cash Flow Model (Excel-Ready Annual Data)
| Year | PV Gen (kWh) | PV Revenue (€) | Cool Save (€) | Demand Save (€) | O&M (€) | Net Annual (€) | Cumulative (€) |
|---|---|---|---|---|---|---|---|
| 0 | — | — | — | — | — | −150,000 | −150,000 |
| 1 | 40,500 | 11,340 | 8,486 | 5,940 | −800 | 24,966 | −125,034 |
| 2 | 40,297 | 11,573 | 8,657 | 6,059 | −816 | 25,473 | −99,561 |
| 3 | 40,094 | 11,810 | 8,832 | 6,180 | −832 | 25,990 | −73,571 |
| 4 | 39,894 | 12,052 | 9,009 | 6,304 | −849 | 26,516 | −47,055 |
| 5 | 39,694 | 12,299 | 9,189 | 6,430 | −866 | 27,052 | −20,003 |
| 6 | 39,496 | 12,551 | 9,372 | 6,558 | −883 | 27,598 | +7,595 |
| 10 | 38,513 | 13,605 | 10,214 | 7,157 | −9,952* | 21,024 | +92,000 |
| 15 | 37,369 | 15,039 | 11,349 | 7,948 | −1,048 | 33,288 | +215,000 |
| 20 | 36,261 | 16,590 | 12,606 | 8,825 | −1,153 | 36,868 | +355,000 |
| 25 | 32,400 | 16,434 | 11,745 | 8,210 | −1,268 | 35,121 | +490,000 |
| Assumptions: 500 m² south facade | PV base 40,500 kWh/yr | 0.5%/yr degradation | €0.28/kWh elec × 2.5%/yr escalation | €0.22/kWh cooling | Demand save €5,940/yr (scaled to 500 m²) × 1.02/yr | O&M €800/yr × 1.02/yr escalation | *Year 10: includes €8,000 inverter replacement. Simple payback: Year 6. 25-yr NPV @ 5% discount: ~€192,000. IRR: ~8.4%. | |||||||
7. Simulation Tools — Choosing the Right Platform for the Job
Three open-access platforms dominate professional-grade solar energy glass estimation. Each has distinct strengths and is best deployed at a specific project stage. Using the wrong tool for the project stage is as much a professional error as applying the wrong accuracy tier.
7.1 NREL System Advisor Model (SAM) — PV Generation Specialist
NREL SAM is the industry standard for photovoltaic generation modelling. For BIPV glass retrofits, set tilt = 90° for a vertical facade and enter the facade azimuth angle. Key inputs: climate file (TMY3 from NSRDB), module STC efficiency, temperature coefficient, and performance ratio. SAM outputs hourly and annual AC generation profiles that integrate directly with financial cash-flow models. Calibration studies show that SAM predictions for facade-mounted systems typically deviate from measured values by ±5–12% annually. SAM does not model building thermal loads, so it must be used alongside a separate cooling-savings calculation or an EnergyPlus model.
7.2 EnergyPlus / DesignBuilder — Full Thermal Building Model
EnergyPlus (U.S. DOE, free) and its commercial GUI DesignBuilder model every building zone’s thermal interactions, HVAC setpoint response, occupancy schedules, and lighting dimming response to daylight. The glazing is parameterized using LBNL WINDOW software outputs (U-value, SHGC, VLT, and spectral transmission data). For a BIPV retrofit, the “before” model uses existing glazing properties; the “after” model substitutes the BIPV glass specification. The annual difference in HVAC energy (cooling and heating combined) is the thermal savings component. Key calibration targets per ASHRAE Guideline 14: CV-RMSE ≤15% monthly, MBE within ±5%.
7.3 PVGIS and PVWatts — Web-Based Tier 1–2 Screens
PVGIS (EU Joint Research Centre, free) and PVWatts (NREL, free) are web-based tools appropriate for rapid screening and concept-stage work. PVGIS accepts vertical-surface inputs directly (azimuth and tilt = 90°), returning annual irradiation on any facade orientation across Europe, Africa, and Asia within seconds. PVWatts serves the same function for North American projects. Neither tool models building thermal loads or daylighting, so both must be paired with a separate cooling-savings calculation.
7.4 Video: Understanding BIPV — Energy Savings Explained
Video: “Understanding BIPV” — covers how building-integrated photovoltaic glass functions, how each savings stream is generated, and how energy savings are quantified in real projects. Recommended for client briefings at the concept stage.
8. Real-World Case Studies — Measured Data, Not Projections
The following five case studies are drawn from peer-reviewed publications, independently audited reports, and manufacturer-documented installations. All energy figures are measured or independently verified post-installation — not simulation projections. These datasets provide the empirical anchor points for validating your own estimation models.

🏢 Case Study 1: Helmholtz-Zentrum Berlin Living Lab
- System
- 360 CIGS colored modules, 3 facades, 379 m² PV area, 48.72 kWp
- South yield
- 101.2 kWh/m²/yr (measured 2022)
- West yield
- 64.8 kWh/m²/yr (measured 2022)
- Total gen.
- ~32,000 kWh/yr (2022 record: 5.3% above simulation)
- Incremental cost
- €301/m² over conventional aluminum
- Annual saving
- €21.70/m² at €0.26/kWh
- Payback
- 14 yr (17 yr incl. inverter replacement)
- CO₂ saved
- 11.4 t CO₂e/yr (380 g/kWh German grid)
🏫 Case Study 2: Educational Building, Hong Kong
- System
- Colored semi-transparent BIPV glass, south-facing facade
- SHGC change
- Existing → BIPV (colored glass, 7% efficiency loss)
- Net energy reduction
- 15% (27.9 MWh/yr measured)
- Lighting load
- 51.3% of Feb. lighting load met by facade daylighting
- Vs simulation
- +8% above model (albedo from surrounding paving)
🏗️ Case Study 3: 1970s Office Block, Central Europe
- System
- Semi-transparent BIPV IGU replacing single-pane (SHGC 0.87 → 0.25)
- Primary energy
- 42% reduction (185 → 107 kWh/m²/yr EUI)
- PV generation
- 18,500 kWh/yr from 220 m² south + east facades
- Cooling saving
- 38% in summer peak months
- 25-yr NPV
- €+142/m² at 5% discount
- IRR
- 7.8%
🌇 Case Study 4: UAE Office Building (Hot Desert Climate)
- System
- PV glass replacing conventional window glazing, EnergyPlus model validated against metered data
- Cooling load
- ~30 kW peak reduction — matchable by on-site PV plant
- Climate
- Hot arid (Dubai equivalent); highest cooling-saving potential globally
- Key finding
- PV glass cooling reduction and PV generation were near-equal, pointing to self-sufficient cooling scenario
📐 Case Study 5: UC Davis BIPV IGU Comparison Study
- System
- Side-by-side comparison: BIPV IGU vs Low-E IGU in identical office test rooms
- Electricity saving
- 16.8% total electricity reduction (BIPV vs Low-E IGU)
- Method
- Comparative room study with metered split systems; 12-month monitoring
- Key finding
- Cooling savings and lighting savings were approximately equal contributors to total electricity reduction
Comparative Case Study Summary Table
| Project | Facade Area | Climate | Energy Reduction | Annual kWh Impact | Payback | CO₂ Saved/yr |
|---|---|---|---|---|---|---|
| Berlin HZB Living Lab | 379 m² | Temperate (Cfb) | ~15% EUI | 32,000 kWh gen. | 14–17 yr | 11.4 t CO₂e |
| Hong Kong Educational | ~300 m² | Subtropical (Cwa) | 15% net energy | 27,900 kWh saved | 12–16 yr | ~9.5 t CO₂e |
| Central Europe 1970s Office | 220 m² | Temperate (Cfb) | 42% EUI | 18,500 kWh gen. | 10–14 yr | ~7.0 t CO₂e |
| UAE Office Building | ~500 m² | Hot arid (BWh) | ~30 kW peak cooling | High; not published | 4–8 yr (est.) | ~25+ t CO₂e (est.) |
| UC Davis BIPV IGU | Test rooms | Mediterranean (Csa) | 16.8% total elect. | Per-room basis | 8–14 yr (est.) | Variable |
| Sources: MDPI 2025; ScienceDirect 2024; eScholarship UC Davis; Springer 2025. All energy figures from measured or independently verified post-installation data. | ||||||
9. Sensitivity Analysis and Risk — Protecting Professional Credibility
A sensitivity analysis is not a hedge or a disclaimer — it is a professional obligation. Presenting a single NPV figure without uncertainty bounds exposes the estimator to credibility risk if actual performance deviates. It also misses a strategic value: if the model reveals that electricity price escalation drives 32% of NPV variance, the team should investigate hedging through a Power Purchase Agreement rather than spending additional engineering budget refining the glazing specification.
32%
Electricity Price Escalation
1.5%/yr vs 4.0%/yr — largest single driver
28%
Discount Rate
3% vs 8% — green bond financing closes this gap
22%
Cooling Load Reduction Achieved
12% vs 30% — pre-installation SHGC measurement is essential
10%
Occupant Behavior Factor
0.75 vs 1.15 — smart glass control systems reduce this variance
8%
Module Degradation Rate
0.3%/yr vs 0.8%/yr — mitigated by 25-yr linear power warranty
Source: MDPI — Assessment Methods for Building Energy Retrofits (2025); ScienceDirect Monte Carlo economic risk assessment in energy retrofits (2024); ResearchGate NPV Monte Carlo sensitivity analysis methodology.
9.1 Tornado Chart — One-at-a-Time Sensitivity Ranking
| Rank | Input Variable | Conservative → Optimistic | NPV Impact (500 m² project) | Recommended Mitigation |
|---|---|---|---|---|
| 1 | Electricity price escalation | 1.5% → 4.0%/yr | ±€40–60k | Energy Price Agreement or PPA with fixed rate |
| 2 | Discount rate | 8% → 3% | ±€50–80k | Green bond financing, ESG fund access |
| 3 | Cooling load reduction | 12% → 30% | ±€20–35k | Pre-installation SHGC measurement; Tier 3 simulation |
| 4 | Occupant behavior factor | 0.75 → 1.15 | ±€24–40k | Occupancy-based smart glass transparency control |
| 5 | Module degradation rate | 0.8% → 0.3%/yr | ±€8–12k | Require IEC 61215-certified 25-yr linear power warranty |
| 6 | Demand tariff structure | Flat rate → high demand | ±€0–72k | Model both scenarios; review utility tariff trajectory |
| Sources: MDPI Building Energy Retrofit Assessment Methods 2025; ScienceDirect Monte Carlo EC financing study 2024. | ||||

9.2 Monte Carlo Simulation — the Standard for High-Value Projects
For projects above €500,000 total investment, a Monte Carlo simulation (minimum 1,000 iterations) using probability distributions for each key input provides a probability distribution of NPV outcomes. Presenting “85% probability that NPV exceeds €80,000” is a far more defensible board-level statement than “projected NPV: €140,000.” Excel add-ins including @RISK (Palisade) and Crystal Ball (Oracle) are the professional standard; R and Python offer free alternatives. A 2024 ScienceDirect study on EC financing decisions for energy retrofits found that projects backed by Monte Carlo risk reports achieved lender approval 34% faster than those with deterministic estimates.
10. The 5 Most Common Estimation Errors — and How to Avoid Them
Error 1 — Applying Rooftop Performance Ratios to Facade Systems
Rooftop systems with optimal tilt achieve performance ratios of 0.78–0.85. Facade-mounted BIPV systems typically achieve 0.72–0.80, due to higher incidence-angle losses at vertical mounting, greater temperature variation across the facade, and increased soiling risk at lower heights. The Berlin Living Lab measured a PR of approximately 0.78 only because of precise zone-by-zone string monitoring and shading optimization. Using 0.85 on a vertical facade application overstates annual generation by 6–15%.
Error 2 — Double-Counting Cooling Savings When Replacing Shaded Glazing
Where existing glazing was protected by external Venetian blinds, retractable awnings, or architectural overhangs, the effective baseline SHGC is already reduced by those shading devices. Calculating SHGC reduction from the unshaded glass SHGC (0.70) rather than the in-use shaded SHGC (effectively 0.35–0.50 with blinds deployed) can overstate cooling savings by 40–60%. Always model the baseline as “existing glazing plus existing shading devices as typically operated.”
Error 3 — Ignoring the Heating Penalty in Temperate and Cold Climates
A lower SHGC BIPV glass that reduces summer cooling loads will also reduce passive solar heat gain in winter, increasing heating loads. In Berlin (HDD 3,100), replacing SHGC 0.60 south-facing glass with SHGC 0.25 BIPV glass can increase annual heating energy by 8–15 kWh/m²/yr — a penalty that must be subtracted from gross savings. In the Berlin HZB Living Lab, the team specifically addressed this by using high-performance framing to compensate for increased heating. Omitting the heating penalty overstates net savings by 5–20% in cold climates.
Error 4 — Using STC Efficiency Directly in Annual Yield Calculations
STC conditions (25°C cell temperature, 1,000 W/m² irradiance, AM 1.5 spectrum) represent optimal laboratory conditions that facade modules never achieve in practice. Real-world facade operation involves higher cell temperatures (+10–25°C above STC in summer), lower irradiance levels on vertical surfaces, and non-standard spectrum from diffuse light. Using the formula Area × STC efficiency × Annual Irradiation without a performance ratio and temperature de-rating will overstate generation by 10–25% depending on climate. Always use PVGIS or SAM, which apply temperature and irradiance corrections automatically.
Error 5 — Omitting M&V Costs from the Financial Model
A professionally defensible savings estimate must include the cost of measuring and verifying those savings post-installation. ASHRAE Guideline 14 M&V costs typically range from 1–3% of annual savings value for simple metering, rising to 5–8% for whole-building calibrated M&V. Omitting this from the NPV model creates a gap between projected financial returns and reported returns that erodes client trust over the monitoring period. Include M&V as a recurring annual cost line in the cash-flow model from Year 1.
11. Assumptions Register and Professional Validation Checklist
Every solar energy glass retrofit savings estimate must be accompanied by a documented assumptions register. The checklist below covers the minimum required for a professionally defensible report. Each item should be signed off by the lead estimator and, for high-value projects, independently reviewed by a peer engineer.
- A minimum of 24 months of weather-normalized baseline utility data has been secured, reviewed, and documented with source information.
- Existing glazing SHGC and U-value have been measured or verified from original procurement records — not assumed from visual inspection or building age.
- The facade has been zoned by orientation; irradiance modelled per zone using PVGIS or NSRDB TMY3 climate data — not a single building-average figure.
- BIPV glass specification confirmed in writing: VLT, SHGC, power density, temperature coefficient, IR rejection, and 25-year warranty retention rate — all from IEC-certified test report. (Reference: Jia Mao BIPV transparent glass specification)
- Estimation tier selected and documented with justification based on project stage and investment size.
- Three savings streams (PV generation, cooling load, peak demand) modelled independently with separate calculation methods and unit rates.
- Performance ratio selected for facade-mount application (0.72–0.80), not rooftop-mount PR (0.78–0.85).
- Occupant behavior factor applied with documented basis (range: 0.75–1.15) and sensitivity case.
- Module degradation rate sourced from NREL degradation study or manufacturer’s IEC-certified warranty document.
- Heating penalty calculated and subtracted from gross cooling savings for all projects in heating-degree-day climates above HDD 1,500.
- Existing shading devices included in baseline SHGC calculation — not removed from the “before” model.
- Sensitivity analysis completed for the top-5 NPV drivers; results presented alongside base-case NPV.
- Incremental investment cost confirmed: BIPV system cost minus cost of conventional facade material avoided.
- Measurement & Verification (M&V) plan defined and costed before project financial commitment is made.
- All sources cited in the assumptions register are publicly accessible, peer-reviewed, or IEC-certified; no savings claim is based solely on manufacturer projections.
Jia Mao BIPV transparent glass
provides a comprehensive IEC 61215-certified technical datasheet with all parameters required for Tier 2–4 simulation models — including SHGC by transparency level (0.15–0.45), temperature coefficient (−0.29%/°C), annual energy yield range (180–250 kWh/m²), and a 25-year linear power warranty guaranteeing 80% output retention. Review the 2026 glass-integrated solar facade systems review and the solar glass selection guide for efficiency, aesthetics, and ROI for full specification support.

Ready to Model Your Building’s Solar Glass Retrofit?
Jia Mao BIPV provides full IEC-certified technical datasheets, specification support, and product data ready for direct input into EnergyPlus and NREL SAM — for architects, engineers, and energy consultants specifying transparent and opaque BIPV glass systems globally.
🔆 Explore BIPV Glass Products →
📐 BIPV Integration Step-by-Step Guide →
📊 2026 Glass-Integrated Facade Review →
الأسئلة المتداولة
The following questions address the most common decision-points for building owners, engineers, and consultants considering solar energy glass retrofits — optimized for direct answer engines and voice search.


-300x300.jpg)